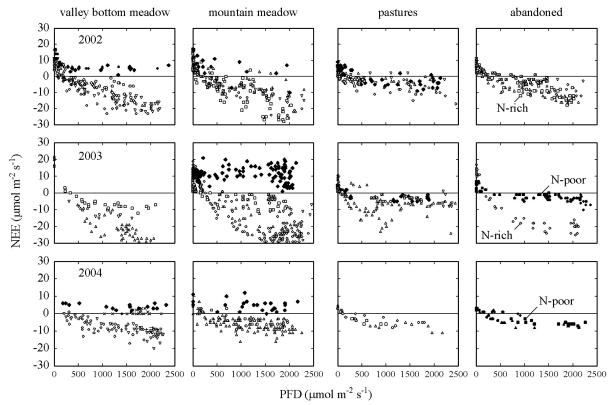
Fig. 2.
NEE in relation to photon flux density (PFD) for two meadows, two pastures and two abandoned grasslands during the growing seasons 2002–2004. Negative values denote net CO2 uptake by the canopy, positive values a net loss of CO2 to the atmosphere. Each data point shows a single set of chamber measurements. The measurements were taken during clear days. The following symbols are used: × March, + April,  May,
May,  June, Δ June,
  August,
  September,
  October,
  November; closed symbols indicate NEE after mowing and grazing on the meadows at the valley bottom (1000 m) and the mountain slope (1850m), as well as the pastures. For the abandoned sites open and closed symbols indicate values for the nutrient-rich and the nutrient-poor abandoned grassland, respectively.

