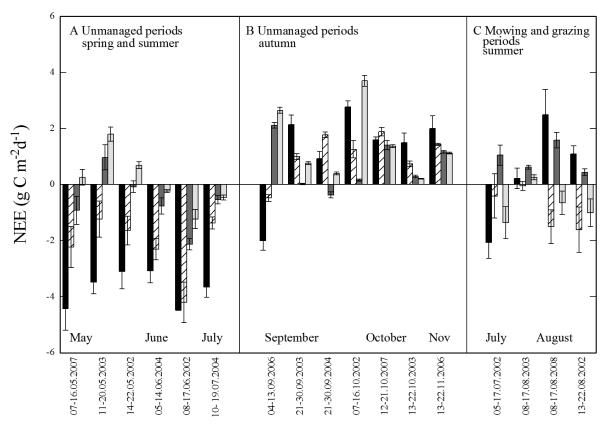
Fig. 3.
Daily integrated average net ecosystem exchange of CO2 (NEE; g C m−2 s−1) of (A, B) unmanaged, and (C) mowing and grazing periods from 2002 to 2008. Groups of bars refer to the same 10-day time periods for all sites as explained in the text. NEE was calculated using Eq. (2) based on 10-day periods during which at least one complete day of chamber measurements was available, and using site-specific microclimatic conditions as input. Sites are indicated by black bars (valley bottom meadow), criss-cross bars (mountain meadow), dark grey bars (pastures) and light grey bars (abandoned). Error bars represent standard errors and reflect the temporal variability in meteorological input parameters to Eq. (2).

