Fig. 4.
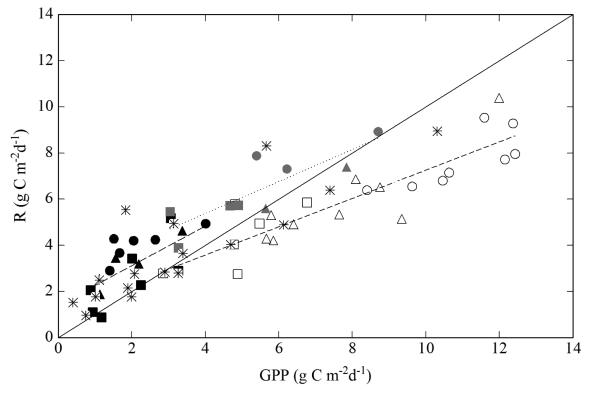
Relationship of daily integrated average gross primary productivity (GPP) and ecosystem respiration (R) at all sites for unmanaged and mowing and grazing periods from 2002 to 2008, as based on the approach for Fig. 3. Sites and management periods are indicated by symbols: circles (valley bottom meadow), triangles (mountain meadow), quadrats (pastures) and stars (abandoned); open symbols (unmanaged periods, spring and summer), closed symbols (un-managed periods, autumn) and grey symbols (mowing and grazing periods, summer). The solid line is the 1:1 line, the dotted regression lines indicate linear relationships, as described by R = a× GPP + b. a, b and R2 of the linear regressions are as follows: 0.61, 1.13 and 0.80 for unmanaged periods in spring and summer, 0.86, 1.41 and 0.44 for unmanaged periods in autumn, and 0.69, 2.60, 0.71, respectively, for mowing and grazing periods (during summer).

