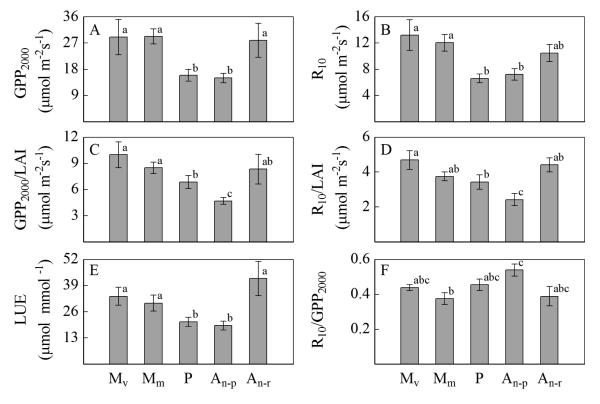
Fig. 6.
Mean peak season values of (A) gross primary productivity per unit ground area at a photon flux density of 2000 μmol m−2 s−1 (GPP2000), (B) ecosystem respiration at a reference temperature of 10 °C (R10), (C) GPP2000 per unit leaf area, (D) R10 per unit leaf area, (E) light use efficiency (LUE), (F) R10/GPP2000 at optimum LAI based on all field campaigns across all study years. Sites are indicated as: Mv (valley bottom meadow), Mm (mountain meadow), P (pastures), An–r (nutrient-rich abandoned grassland), An–p (nutrient-poor abandoned grassland). Significantly different means are indicated by different letters (oneway ANOVA). Error bars represent standard errors, Mv: n=4 (May 2002 to 2005), Mm: n=7 (August 2002 to 2004 and 2006 to 2008), P: n=7 (August 2002 to 2004 and 2006 to 2008), An–p: n=6 (August 2003 to 2004 and 2006 to 2008), An–r: n=2 (March 2002 to 2003).

