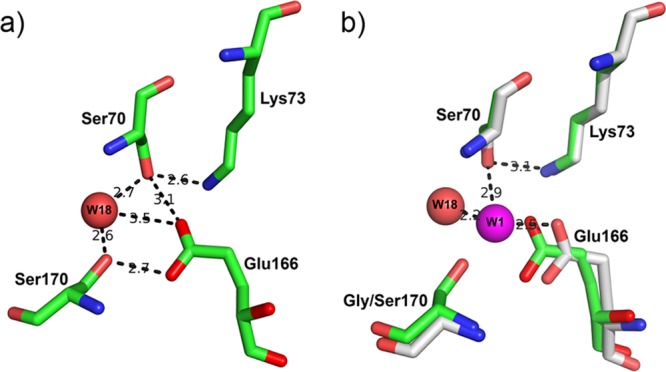
Fig 3.

(a) Representation of the active site of GES-18. The network of hydrogen bonds is represented. (b) Superimposition of the respective active sites of GES-1 (in gray) and GES-18 (in green). The hydrolytic water molecule is represented in magenta for GES-1 (W1) and in red for GES-18 (W18). W18 is shifted by 2.15 Å compared to its position in GES-1. The hydrogen bond distances between W1 and Ser70, Lys73, and Glu166 are also represented.
