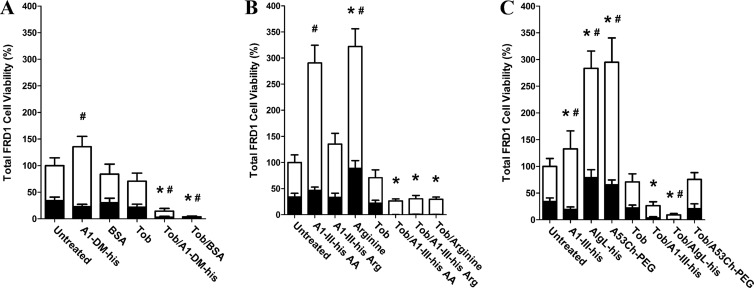
Fig 3.
Analysis of P. aeruginosa viability following biofilm treatments. Mucoid FRD1 biofilms were treated for 12 h with a panel of biologic reagents, tobramycin, or combinations thereof. alamarBlue was then used to quantify cell viability in the remaining adherent biofilm (black bars), as well as in the treatment supernatant containing detached planktonic cells (white bars). (A) A1-DM-His alginate lyase and BSA were used to assess the effects of protein treatments that lacked alginate-degrading activity. (B) Treatments consisting of individual amino acids were used to assess whether higher-order protein structure was required for tobramycin synergy. The treatments were composed of (i) A1-III–His AA, with each individual amino acid at the same concentration as its specific molar contribution to 1,000 μg/ml intact A1-III–His; (ii) A1-III–His Arg, with arginine at the same concentration as its specific molar contribution to 1,000 μg/ml intact A1-III–His; and (iii) arginine, with arginine at the same molar concentration as the total of all individual amino acids in 1,000 μg/ml intact A1-III–His. (C) Treatment with diverse alginate lyase enzymes was used to assess the effects of varied catalytic activity and proteolytic sensitivity. A1-III–His was repeated as a positive control. AlgL-His was included as a reduced-activity enzyme evolved to function specifically on bacterial alginate. A53C-His-PEG is a genetically engineered and PEGylated variant of A1-III–His that exhibits nearly identical solution phase kinetics but should have greater resistance to proteolytic degradation. The error bars represent standard deviations from six replicates. For biofilm cells, statistically significant (α = 0.05) differences relative to untreated biofilm are marked with asterisks. For planktonic cells, statistically significant (α = 0.05) differences relative to untreated biofilm are marked with pound signs.

