Fig 3.
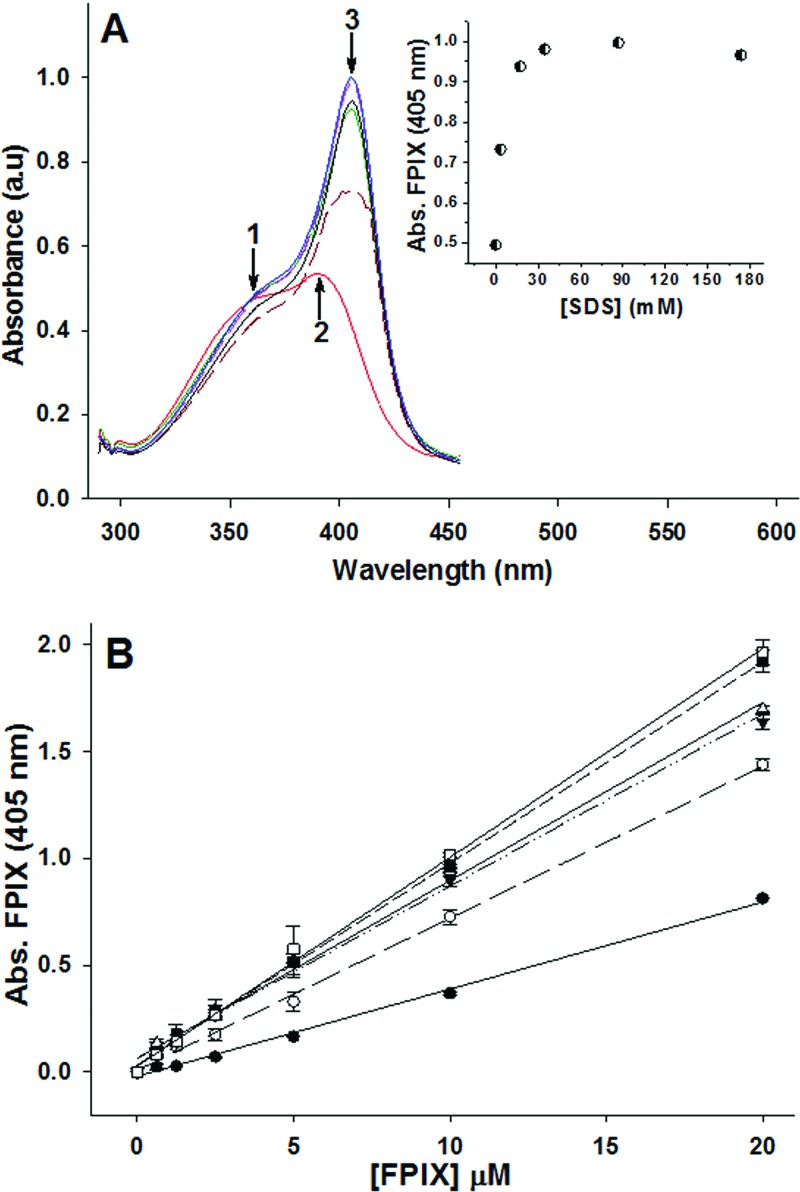
(A) SDS effects on the absorbance spectrum of FPIX. Increasing amounts of SDS were titrated into a cuvette containing 10 μM FPIX while the absorbance spectrum was recorded after each addition. Results are shown for no SDS (red), 0.1% (3.47 mM) SDS (brown), 0.5% (17.3 mM) SDS (green), 1% (34.7 mM) SDS (black), 2.5% (86.7 mM) SDS (blue), and 5% (173 mM) SDS (pink). (Inset) Peak height at 405 nm versus SDS concentration. a.u., absorbance units. (B) Effect of SDS on the concentration-dependent absorbance (Abs.) of FPIX in the 96-well plate format. Results are shown for no SDS (●, R2 = 0.996), 0.1% (3.47 mM) SDS (○, R2 = 0.988), 0.5% (17.3 mM) SDS (▼, R2 = 0.992), 1% (34.7 mM) SDS (■, R2 = 0.996), 2.5% (86.7 mM) SDS (□, R2 = 0.998), and 5% (173 mM) SDS (Δ, R2 = 0.999). Increasing the concentration of SDS increases the absorbance of FPIX to a maximum at ∼2.5% SDS. Each data point is an average of three independent measurements, each performed in triplicate (9 determinations total).

