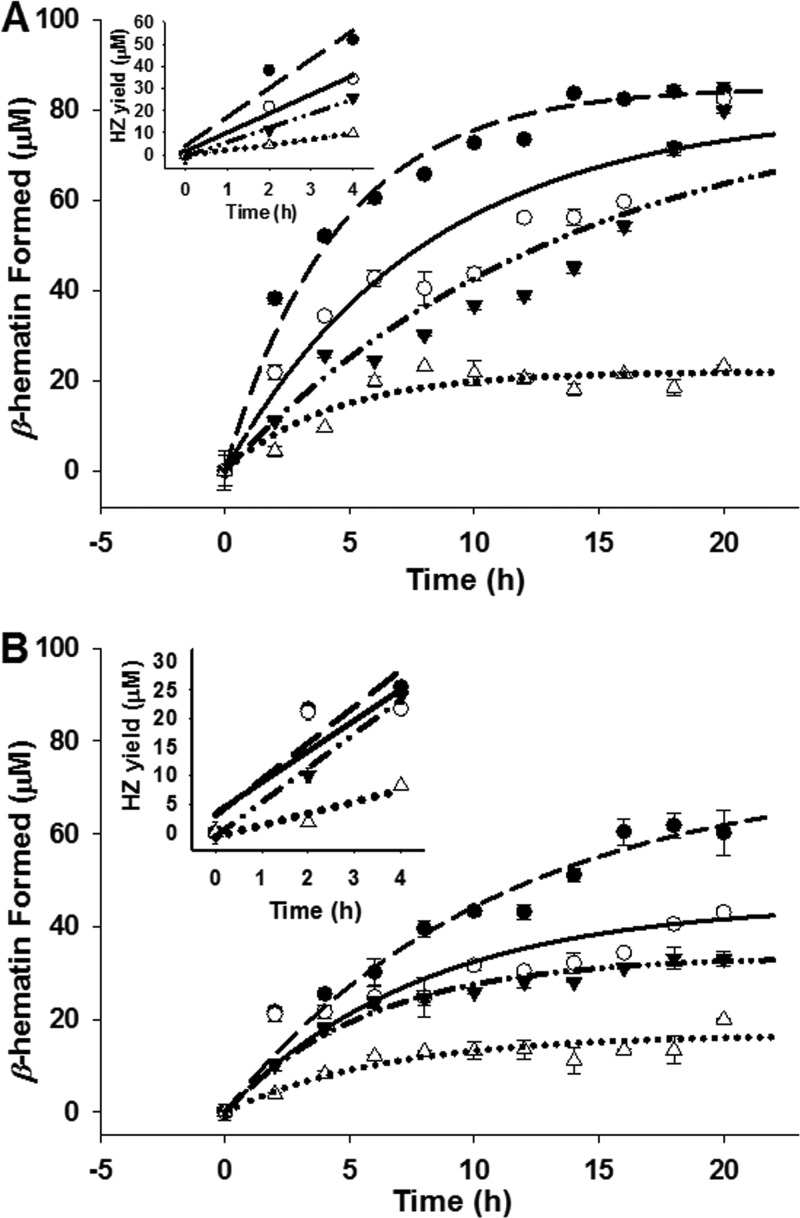
Fig 5.
pH-dependent kinetics for the production of Hz (β-hematin) in the presence of PC (●), pMAG (○), or sMAG (▼) or the absence of a catalyst (Δ). Sonicated lipids were incubated at 37°C with 100 μM FPIX in 200 μl of propionate buffer for 16 h at pH 5.2 (A) and pH 5.6 (B). Curve fitting was performed with SigmaPlot (version 10.0) software using the equation y = a(1 − bx). (Insets) The corresponding initial rate plots from time zero (t0) to 4 h (t4) (Table 1). Inset data are fit to linear regressions, and the initial rates were extracted from the slopes. Each data point is an average of three independent measurements, each performed in triplicate (9 determinations total).

