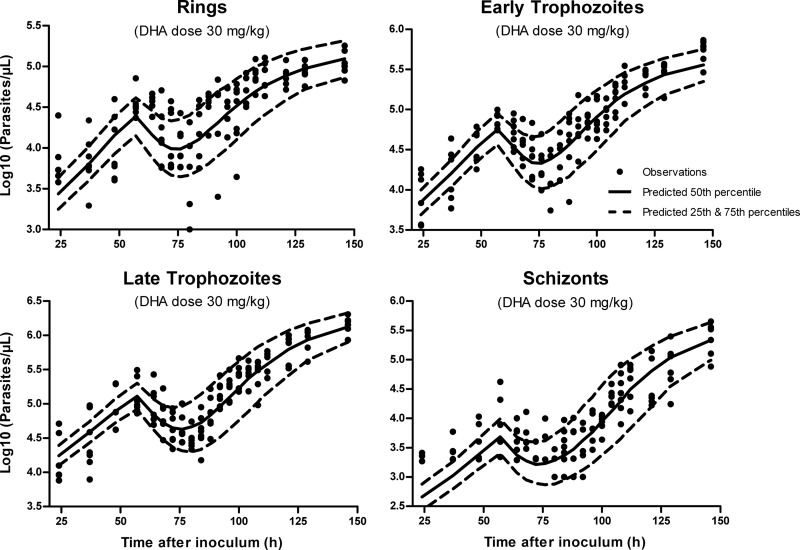
Fig 4.
Visual predictive check (scatterplot) for the mechanism-based model (MBGM-PK-PD) at the representative dose of 30 mg/kg dihydroartemisinin. Predicted medians and 25th and 75th percentiles demonstrate that the model reasonably describes both the central tendency and variability in the observed data.

