
Fig 1.
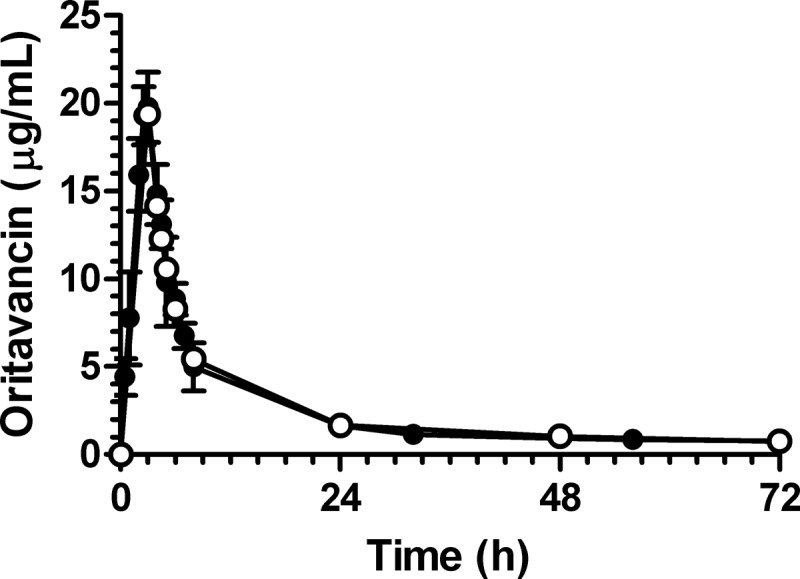
Mean oritavancin concentration-time profiles for single-dose infusion over 3 h as obtained by population PK modeling (○; predicted free drug levels from a single 1,200-mg dose based on estimated 85% protein binding) and as measured in the in vitro PK/PD model (●; n = 8 independent experiments; actual measured drug level in model).