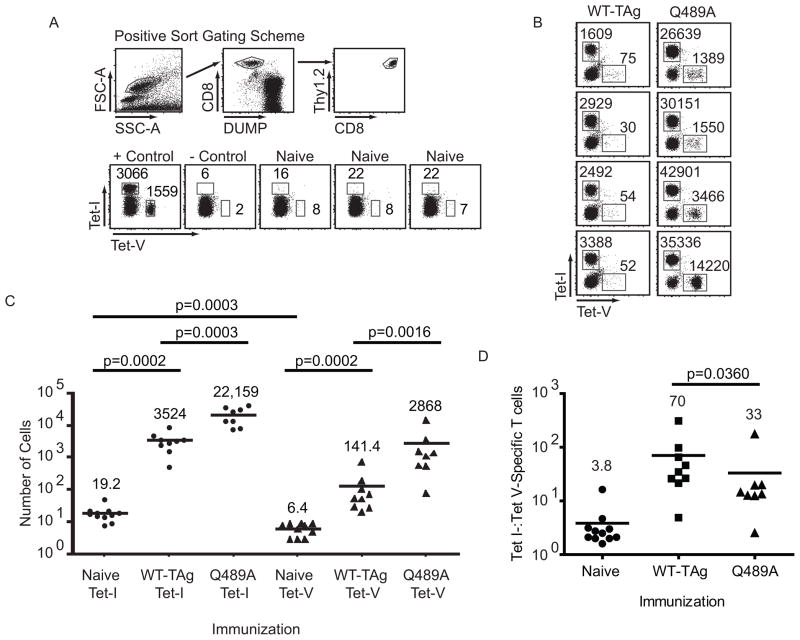
Figure 7.
Endogenous site V-specific T cells proliferate following immunization with WT-TAg cells. (A–C) Total splenocytes and lymphocytes were stained with Tet-I-APC and Tet-V-PE and isolated by magnetic enrichment. (A) The flow-cytometric gating scheme was based on forward-scatter (FSC-A) versus side-scatter (SSC-A) followed by cells positive for CD8 and negative for the DUMP stain and finally CD8+ Thy1.2+ cells (A, top panels). Representative dot-plots from positive and negative control mice and naïve mice are displayed (A, bottom panels). Positive control mice received immunization with WT-TAg cells and transfer of TCR-V cells prior to the day of the experiment. The negative controls were naïve mice that received no tetramer staining prior to magnetic enrichment. (B) Representative plots of TAg-specific T cells obtained from mice seven days following immunization with WT-TAg or Q489A cells. (C) Data compiled from all experiments. Values indicate the number of cells in each gate (A–B) or the mean value of all Tet-V+ or Tet-I+ cells in all experiments (C). The data are representative of two (B) or three (A) experiments comprising at least three mice per group. (D) The ratio of Tet I+ cells to Tet V+ cells from panel C is plotted for individual mice. Bars indicate mean values. P values were calculated using the Mann-Whitney U-Test.

