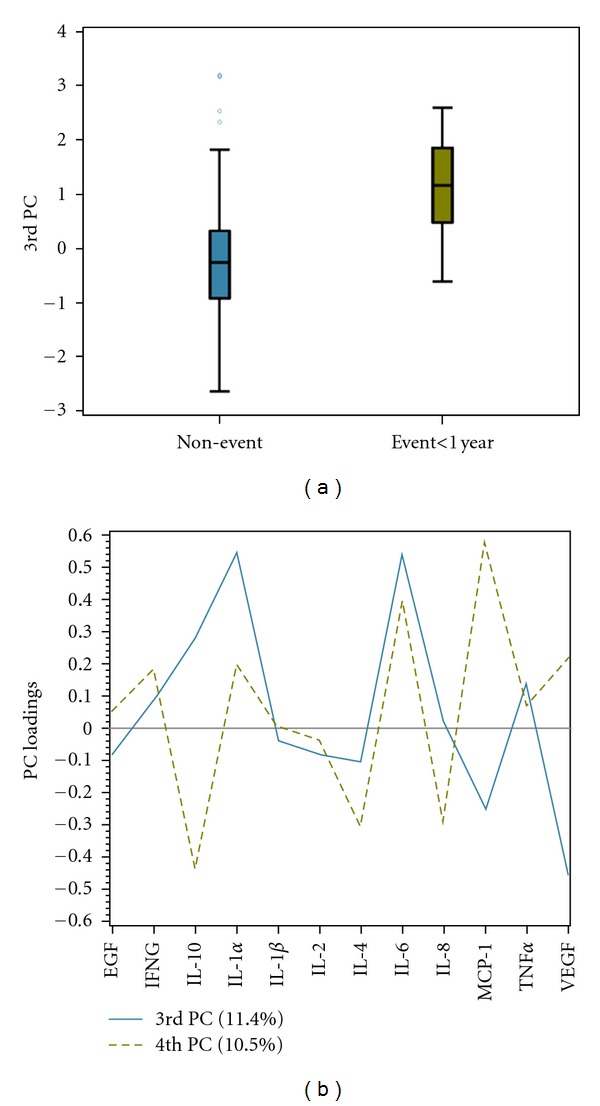
Figure 2.

Dimension reduction using principal component analysis: the third PC was found to be the most associated with outcome. (a) The distribution of the 3rd PC is displayed separately by outcome. Filled areas indicate the interquartile range (distance between 25th and 75th percentiles), the middle line corresponds to the median, and the whiskers contain data within 1.5 interquartile ranges. (b) The PC loadings for the 3rd and 4th PCs are displayed. The 3rd PC is heavily loaded by positive IL-1α and IL-6 and negative VEGF values, whereas the 4th PC is heavily weighted by positive IL-6 and MCP-1 and negative IL-10 values.
