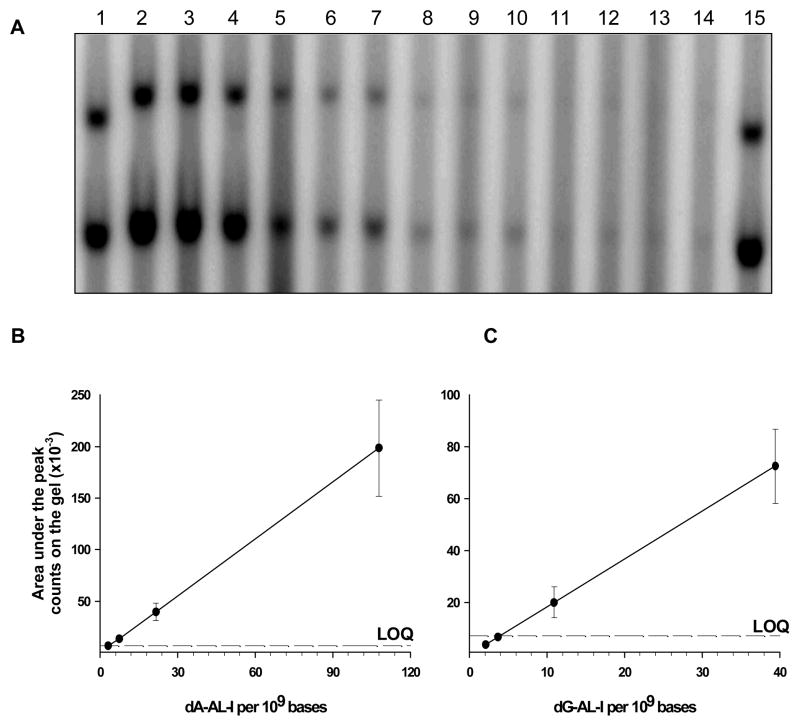
Figure 5.
32P-postlabeling/PAGE analysis of AL-DNA adducts. DNA was obtained from the renal cortex of a mouse treated with AA-I (2 mg/kg) and diluted with unmodified DNA (20 μg total) to arrive at levels of modification of 3, 7, 21 and 108 dA-AL-I adducts per 109 bases. For this experiment, the levels of dG-AL-I adducts are 3 times less than dA-AL-I. The experiment was performed in quadruplicate for the lowest adduct level and in triplicate for higher levels. (A) Lanes 1 and 15 (dA-AL-II and dG-AL-II standards, 80 adducts/109 bases); lanes 2–4 (100 dA-AL-I adducts per 109 bases); lanes 5–7 (21 dA-AL-I adducts per 109 bases); lanes 8–10 (7 dA-AL-I adducts per 109 bases); lanes 11–14 (3 dA-AL-I adducts per 109 bases). Upper and lower bands correspond to dG-AL and dA-AL adducts, respectively. (B) Dose response for dA-AL-I and (C) dose response for dG-AL-I levels measured with Image QuaNT v5.2 software were plotted as a function of adduct modification.

