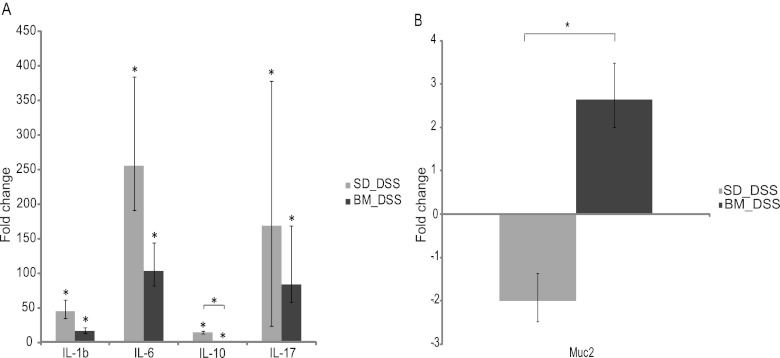
Fig 4.
(A) mRNA levels for the cytokines IL-1β, IL-6, IL-10, and IL-17 in DSS-treated mice given a standard diet or a bacterial meal relative to those in DSS-untreated mice given a standard diet. mRNA levels were determined by real-time PCR. (B) mRNA level for Muc2 in DSS-treated mice given a standard diet or a bacterial meal relative to that in DSS-untreated mice given a standard diet. mRNA levels were determined by real-time PCR. Data are presented as the mean fold change ± standard deviation. Differences between means were tested by one-way ANOVA. A P value of <0.05 was considered statistically significant (*).

