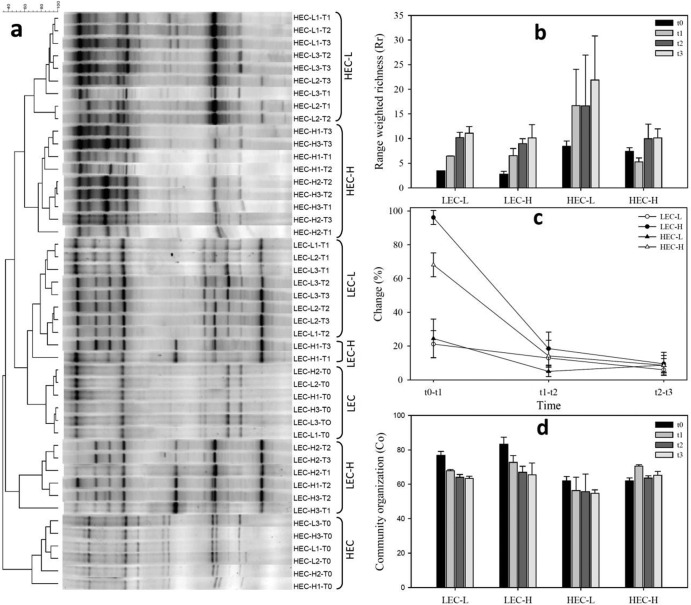
Fig 3.
DGGE profiles and UPGMA (unweighted pair-group method with arithmetic averages) tree (a), range-weighted richness (Rr) (b), moving-window analysis (dynamics) (c), and community organization (Co) (d) of 16S rRNA gene fingerprints of the enrichment cultures. Error bars represent SDs of means of triplicate samples.

