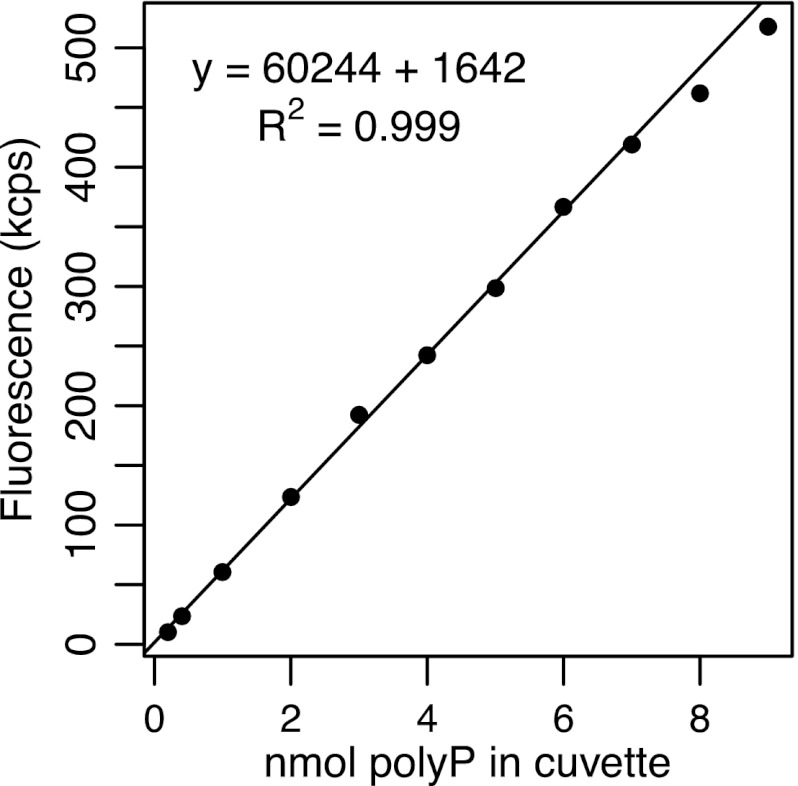
Fig 1.
Typical calibration curve of the fluorescence signal versus the quantity of polyP in the spectrofluorometer cuvette, in nmol orthophosphate equivalents (1 nmol polyP = 1 nmol PO43− upon complete hydrolysis). Since each measurement was made in 3 ml of solution, the calibration curve spans a concentration range of 0.067 to 2.3 μM polyP.

