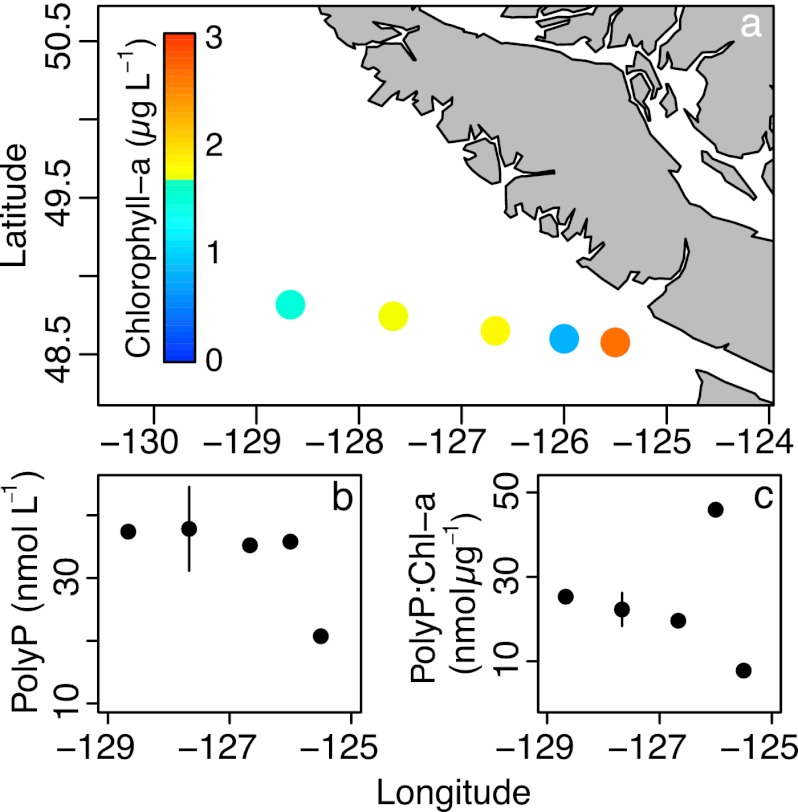
Fig 8.
Particulate polyP was quantified on a transect in the North Pacific after filtering 900 ml of seawater collected at 5-m depth onto GF/F filters. Sampling locations and chlorophyll a concentrations at 5 m are shown in panel a. The concentration of polyP increased from coast to open ocean (b), as did the polyP/chlorophyll a ratio (c). Given the low sample size of this opportunistically sampled data set, we eschewed statistical analysis. The error bars in panels b and c indicate the range of a duplicate polyP measurement of one sample; the data point is the mean of the two measurements.

