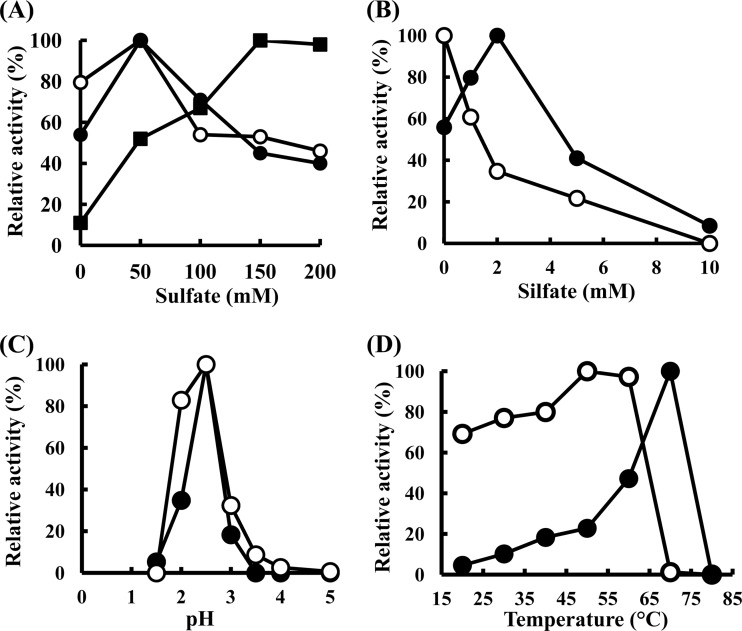
Fig 3.
Effect of sulfate (A), sulfite (B), pH (C), or temperature (D) on TSD activity in Butyl-650M fraction from A. ferrooxidans ATCC 23270 (●) or E. coli BL21(DE3) harboring pET-tsd (○). The effect of sulfate on TSD activity in CM-650M fraction is represented by a black square (■) in panel A. The specific activities (U mg−1) for the 100% value are indicated in the four panels as follows: 3.47 (●), 4.57 (○), and 2.34 (■) (A); 5.47 (●) and 4.57 (○) (B); 3.47 (●) and 4.57 (○) (C); and 13.79 (●) and 6.53 (○) (D).

