
Fig 6.
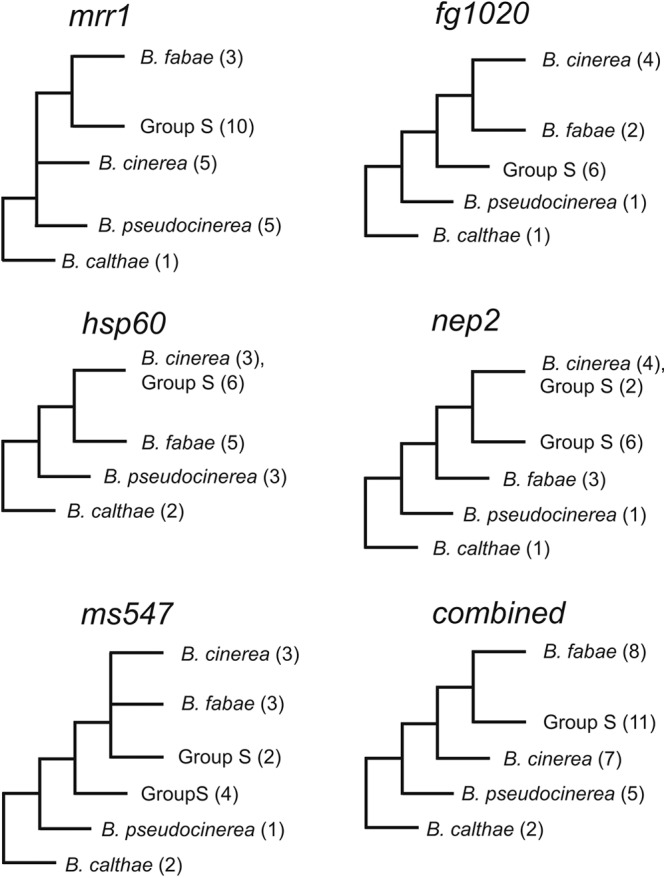
Simplified cladograms based on maximum likelihood analysis of the nucleotide sequence alignments of mrr1, fg1020, hsp60, nep2, and ms547 and on a combined analysis including all five genes from gray mold isolates belonging to different genetic groups and species of Botrytis. Branches receiving bootstrap support lower than 70% were collapsed. Numbers in parentheses indicate the numbers of specimens sequenced within each clade. Full trees for the individual genes are shown in Fig. S4 in the supplemental material, and those for the combined analysis are shown in Fig. S6 in the supplemental material.