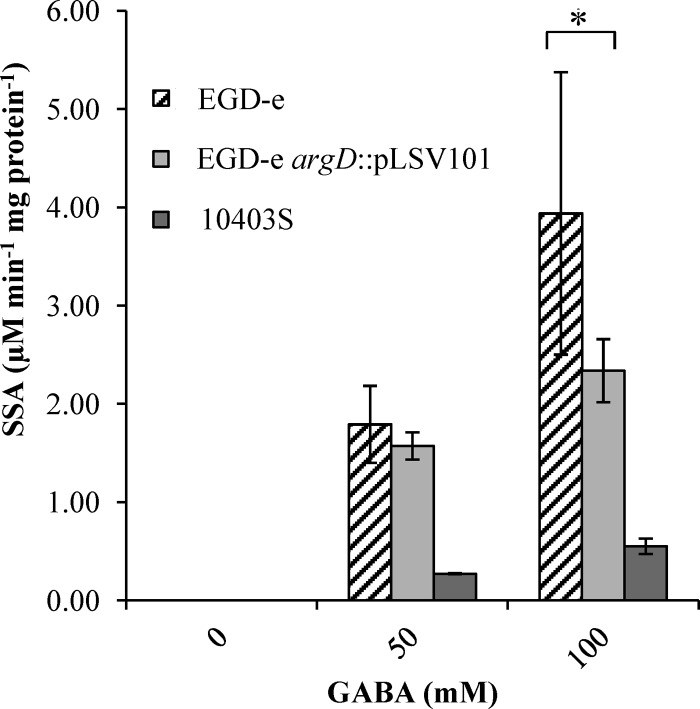
Fig 2.
GABA-AT activity of L. monocytogenes. Values for GABA-AT activities of crude cell extracts harvested after growth overnight (16 h) and incubated with either 0, 50, or 100 mM GABA are shown. Values are means of data from three individual culture replicates. Errors bars shown display the deviations of values seen between each replicate sample. The asterisk indicates a statistically significant difference (P < 0.05), as determined by a Student t test.

