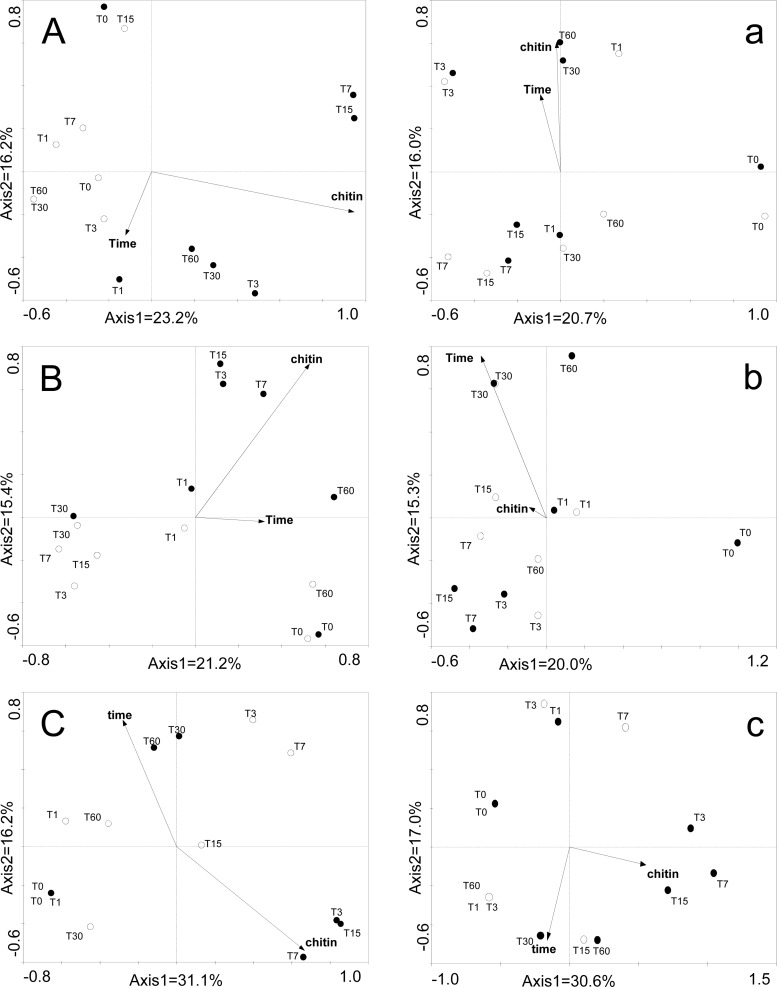
Fig 3.
DGGE patterns from principal coordinate analysis based on Jaccard similarity. (A, a) 16S rRNA. (B, b) Actinobacterial 16S rRNA. (C, c) chiA gene. Uppercase letters represent comparisons of samples at pH 5.7. Lowercase letters represent comparisons of samples at pH 8.7. Empty circles represent samples without chitin and filled circles samples with chitin addition. Positions of circles represent the mean positions of the replicates. The DGGE photos can be found in the supplemental material.

