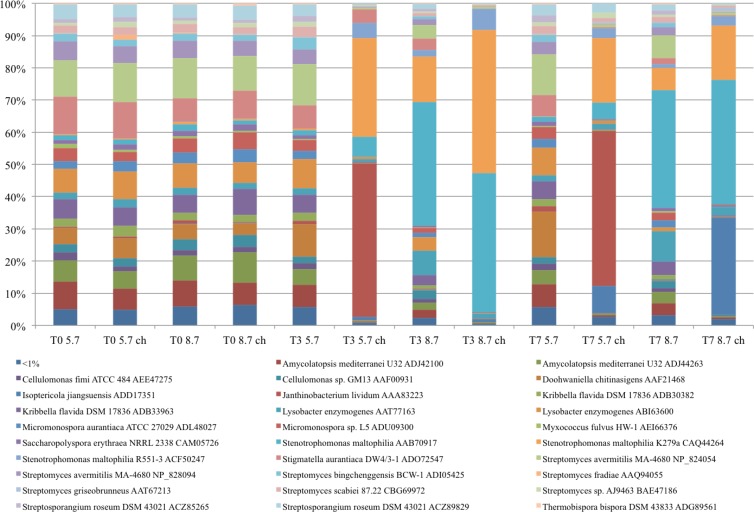
Fig 5.
Comparison of levels of chiA gene diversity at different sampling points. The stacked-column graph represents the relative distributions of chiA genes affiliated with different bacterial species based on BLAST-P analysis. All calculations were performed on normalized data. Average relative abundance data from three replicates were calculated as the ratio between the sequence type abundance and the total number of sequences in the group. Sequence types represented by less than 1% of the sequences are grouped and presented on the graph as the “<1%” group.

