Fig 4.
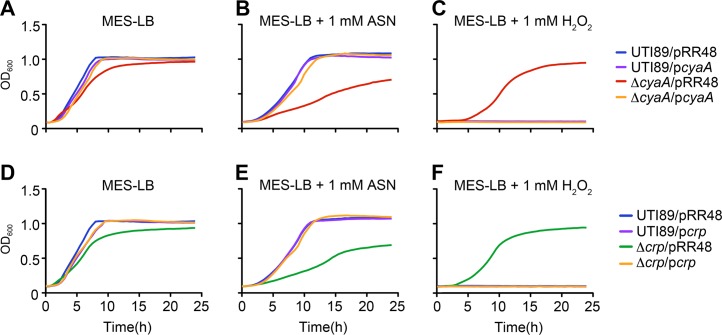
Complementation of UTI89ΔcyaA and UTI89Δcrp in the presence of nitrosative and oxidative stresses. Graphs show growth of UTI89 versus UTI89ΔcyaA (A to C) and UTI89Δcrp (D to F) in MES-LB (A, D), MES-LB ± 1 mM ASN (B, E), or MES-LB ± 1 mM H2O2 (C, F), all without added IPTG. Strains carried pcyaA, pcrp, or the control plasmid pRR48, as indicated. Growth curves show the means of results from a single experiment and are representative of at least three independent experiments carried out in quadruplicate.

