Fig 5.
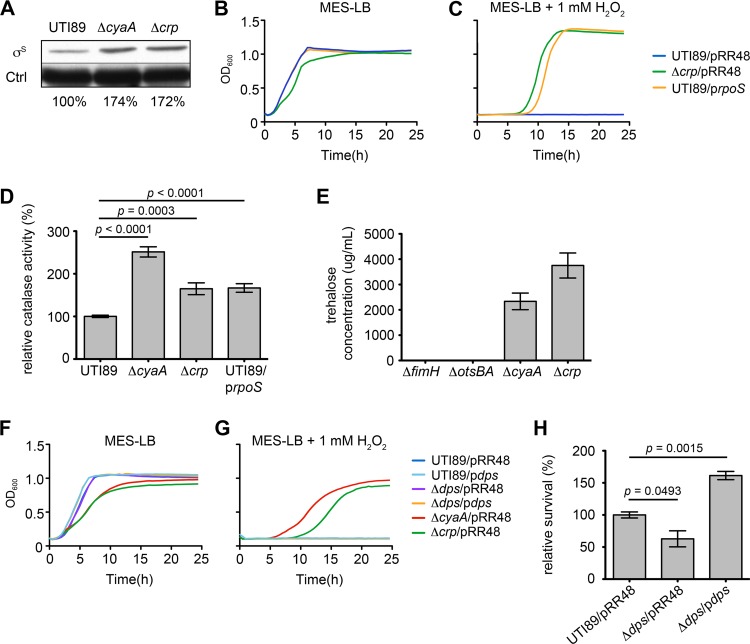
H2O2 resistance correlates with increased RpoS expression and catalase activity in UTI89ΔcyaA and UTI89Δcrp. (A) Western blot of RpoS (σS) in UTI89, UTI89ΔcyaA, and UTI89Δcrp after growth to mid-exponential phase in LB broth. Relative levels of RpoS normalized to loading control (Ctrl) are indicated. (B, C) Curves show growth of UTI89 and UTI89Δcrp carrying empty vector pRR48 or prpoS, as indicated, in MES-LB ± 1 mM H2O2. (D) Graph of catalase activity in UTI89, UTI89ΔcyaA, UTI89Δcrp, and UTI89/prpoS following growth to stationary phase in LB broth + 1 mM IPTG. Data are expressed relative to wild-type UTI89 as the means ± standard errors of three independent experiments carried out in triplicate. (E) Levels of trehalose present in UTI89ΔfimH, UTI89ΔotsBA, UTI89ΔcyaA, and UTI89Δcrp following growth to stationary phase (OD600 = 1.0). The ΔfimH mutant carries the same chloramphenicol resistance cassette as the ΔcyaA and Δcrp mutants and served as the control. (F, G) Graphs show growth of UTI89 and its mutant derivatives (ΔcyaA, Δcrp, and Δdps mutants) carrying pRR48 or pdps, as indicated, in MES-LB ± 1 mM H2O2. Each growth curve (B, C, F, and G) shows the means of results from a single experiment and is representative of at least three independent experiments carried out in quadruplicate. Dps and RpoS expression in these assays was induced by addition of 0.5 mM IPTG. (H) Survival of UTI89Δdps complemented with empty vector pRR48 or pdps following 15 min of exposure to 0.05 M CuSO4. Results were obtained without addition of IPTG and are presented relative to those of wild-type UTI89/pRR48. The indicated P values were determined using two-tailed unpaired t tests.

