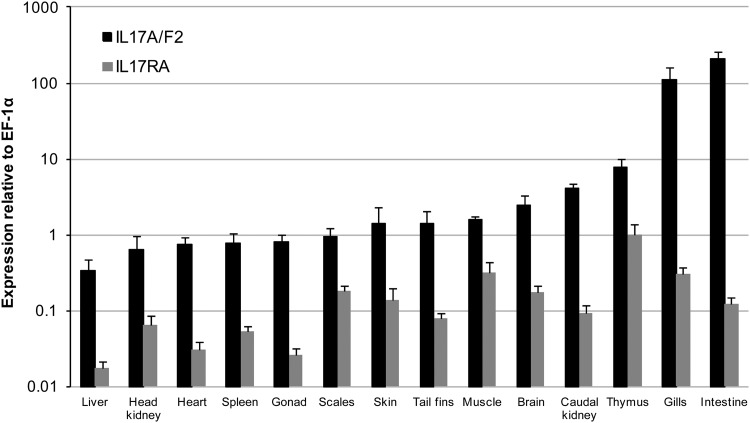
Fig 3.
Expression analysis of trout IL-17A/F2 and IL-17RA in tissues (liver, head kidney, heart, spleen, gonad, scales, skin, tail fins, muscle, brain, caudal kidney, thymus, gills, and intestine) obtained from six healthy fish as detected by real-time PCR analysis. Data represent averages + standard errors of the results of determinations of IL-17A/F2 and IL-17RA expression after normalization to that of elongation factor (EF)-1α.

