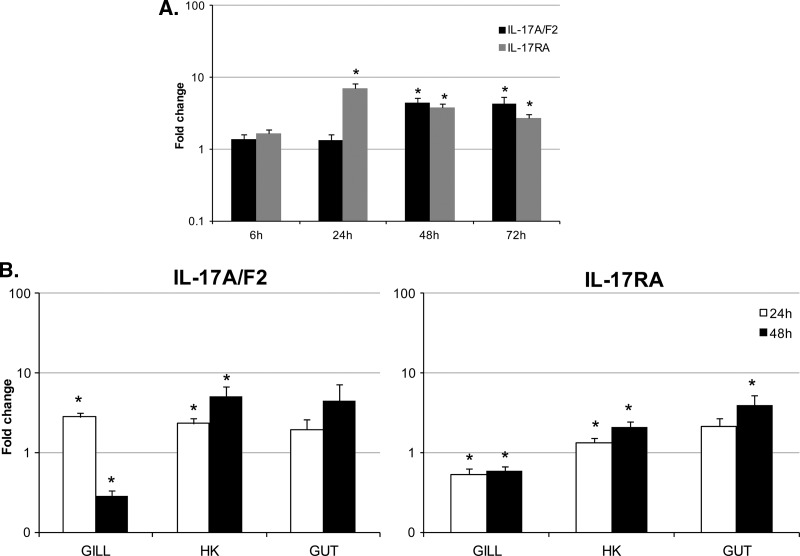
Fig 5.
Expression analysis of trout IL-17A/F2 and IL-17RA during a bacterial infection. (A) Five rainbow trout were injected intraperitoneally with Yersinia ruckeri (0.5 ml; 1 × 10⁶ CFU/fish) or with PBS (0.5 ml/fish). Head kidney tissue was collected at 6, 24, 48, and 72 h after challenge, and RNA was extracted for real-time PCR analysis. (B) Six rainbow trout were bath immersed with Y. ruckeri (2 × 10⁷ CFU/fish) or with control media for 1 h. Gill, head kidney (HK), and gut tissues were collected 24 and 48 h after challenge, and RNA was extracted for real-time PCR analysis. Data were analyzed by the Pfaffl method (48) and are expressed as fold change. Data represent averages + standard errors of the results. Asterisks indicate significant differences (P < 0.05) relative to control. Data were analyzed using the Student T test.

