
Fig 2.
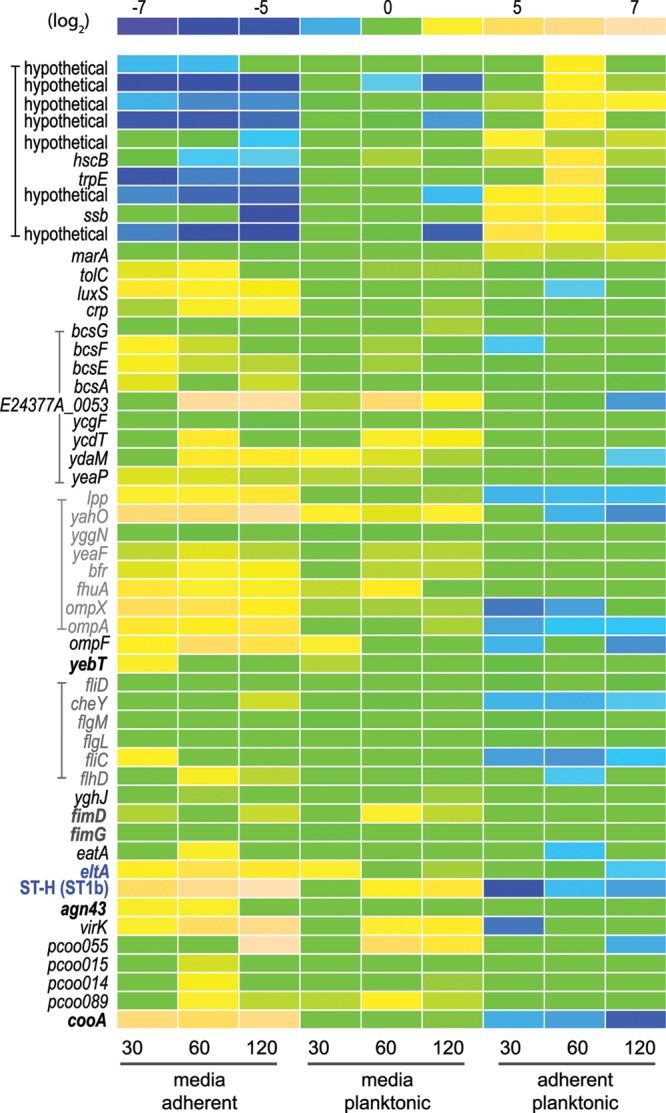
Modulation of ETEC gene expression upon interaction with intestinal epithelial cells. A relative expression intensity scale (log2 values) appears at the top of the figure. Gene features are shown to the left, with related features depicted with brackets/color. Included are known/candidate virulence genes, immunogens, or regulatory genes. The genes most responsive (n = 10) to bacterial adhesion are depicted at the top of the figure. The toxin gene eltA, encoding the LT-A subunit, and the gene coding for heat-stable toxin ST-H (ST-1b) are shown in blue print. Adhesins or putative adhesins are depicted in boldface letters. pCoo plasmid gene designations refer to plasmid-encoded sequences from the pCoo plasmid (64), for which the complete sequence is available at NCBI accession no. NC_007635.1 The conditions and time points (minutes) for each column of data are shown at the bottom of the figure. Data in the far left column depict the fold changes in transcription for bacteria grown in unconditioned tissue culture media relative to the adherent population at 30 min, while those in the far right column represent changes in adherent bacteria relative to planktonic organisms after 120 min. Elements for which there was no significant difference in the microarray data are depicted as 0-fold change (green).