
Fig 1.
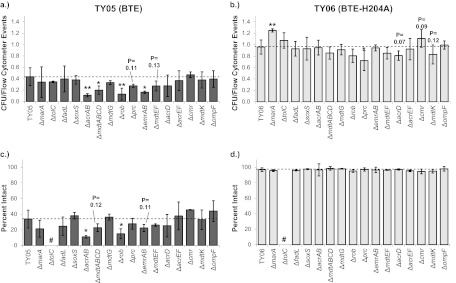
Normalized CFU counts and percentages of intact cells for single gene deletions in strains TY06 and TY05. Panels: a and b, values for strain TY06 (BTE-H204A expressing); c and d, values for strain TY05 (BTE-expressing); a and c, normalized CFU counts (number of CFU per milliliter from plate counts divided by the number of cells per milliliter determined by flow cytometry); b and d, percentages of intact cells measured by SYTOX Green flow cytometry assay. Error bars are standard errors propagated by using cell counts (the number of intact cells with green fluorescence greater than 50, and the number of nonintact cells with green fluorescence greater than 440). *, P < 0.05 (compared to TY06 or TY05); **, P < 0.01 (compared to TY06 or TY05); #, value not calculated (see text).