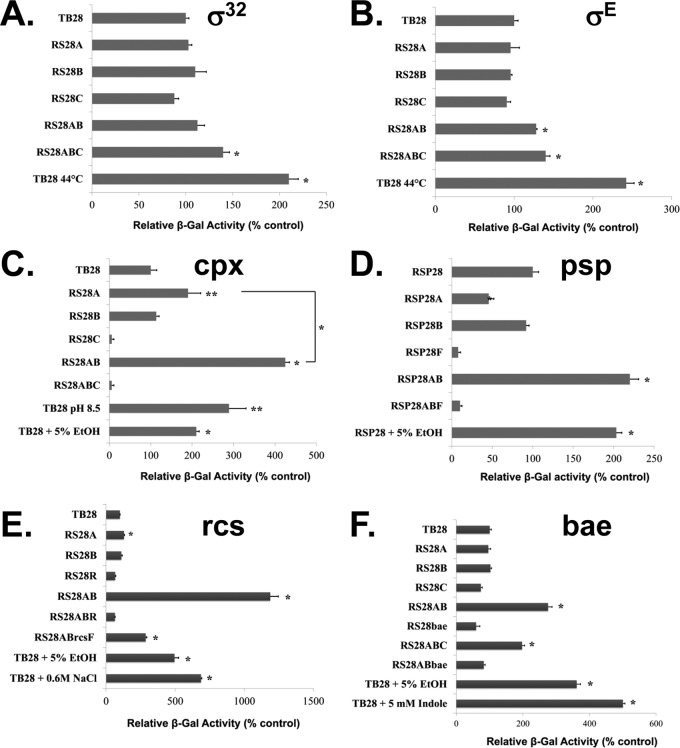
Fig 1.
Activation of stress response pathways. The indicated strains were transformed with plasmid pRS101 (A), pRS102 (B) pSH10 (C), pRS103 (E), or pRS104 (F) to measure induction of σ32, σE, Cpx, Rcs, and Bae pathways, respectively. The induction of Psp stress response was determined by using RSP strains (Table 1) containing the ϕ(pspA-lacZ) (Ampr) chromosomal fusion (D). Cells were grown to exponential phase at 30°C unless otherwise indicated and assayed for β-galactosidase activity. Growth of TB28 at a higher temperature (44°C) for 30 min served as a positive control for induction of σ32 (A) and σE (B) stress responses. Growth of TB28 in alkaline medium (LB medium buffered with 100 mM phosphate buffer at pH 8.5) or in LB supplemented with 5% ethanol (EtOH) for 40 min served as a positive control for Cpx induction (C). Growth of RSP28 in LB supplemented with 5% EtOH for 30 min served as a positive control for activation of the Psp stress response (D). Growth of TB28 in LB supplemented with either 0.6 M NaCl or 5% EtOH for 45 min served as a positive control for Rcs activation (E). Growth of TB28 in LB supplemented with either 5 mM indole or 5% EtOH for 1 h served as a positive control for Bae activation (F). β-Galactosidase activity is expressed as a percentage of that displayed by the control parent strain, TB28. Each bar represents the average and standard deviation of three replicates of a representative experiment. Statistical significance was determined by Student's unpaired t test. The significance values are represented as follows: *, P < 0.001; **, P < 0.01.

