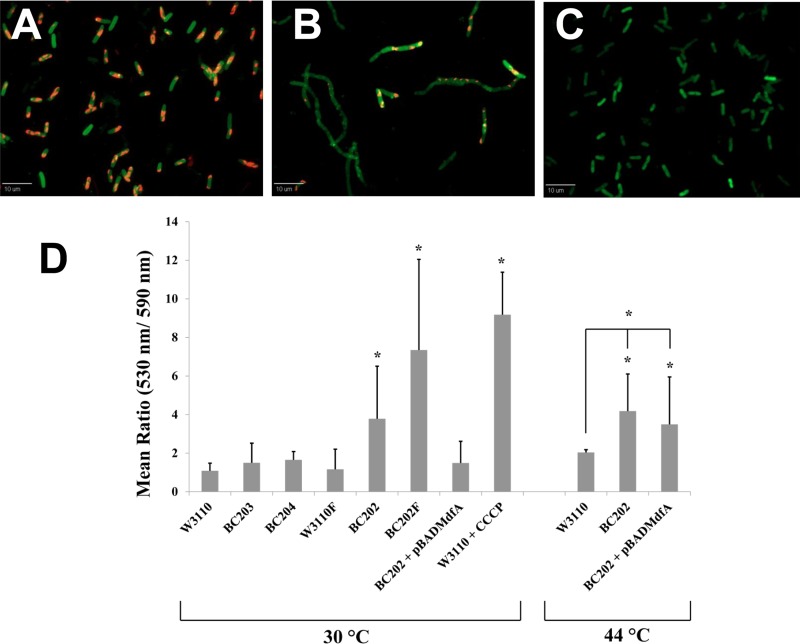
Fig 3.
Assessment of the membrane potential (Δψ) using JC-1 red/green dye-based assay. Strains W3110, W3110F, BC203, BC204, BC202, and BC202F transformed with empty vector pBADhisA and BC202 harboring plasmid pBADMdfA were grown in LB-Amp medium. BC202 harboring pBADMdfA was grown in the presence of 0.2% arabinose. W3110 treated with 100 μM CCCP for 20 min served as a control for loss of Δψ. As indicated, strains were grown at either 30°C or 44°C. Membrane potential at higher growth temperatures was determined by growing strains W3110, BC202, and BC202 harboring pBADMdfA at 44°C for 1 h. All strains were treated with JC-1 dye in a permeabilization buffer as described in Materials and Methods and subjected to fluorescence deconvolution microscopy. The red and green intensities were captured using the TRITC (590 nm; exposure time, 300 ms) and the GFP (530 nm; exposure time, 1,500 ms) filter sets, respectively, and quantified using Slidebook software. (A to C) Fluorescent red-green overlay images of W3110 (A), BC202 (B), and W3110 treated with CCCP (C). (D) Changes in Δψ are presented as the green (530 nm)/red (590 nm) ratio. Each bar represents the mean and standard deviation of the ratio of total red and green intensities determined from 100 cell units (cells or chains) from three independent experiments. Statistical significance was determined by Student's unpaired t test. The significance values are represented as follows: *, P < 0.001; **, P < 0.01. An increase in the green/red ratio indicates a decrease in membrane potential (Δψ).

