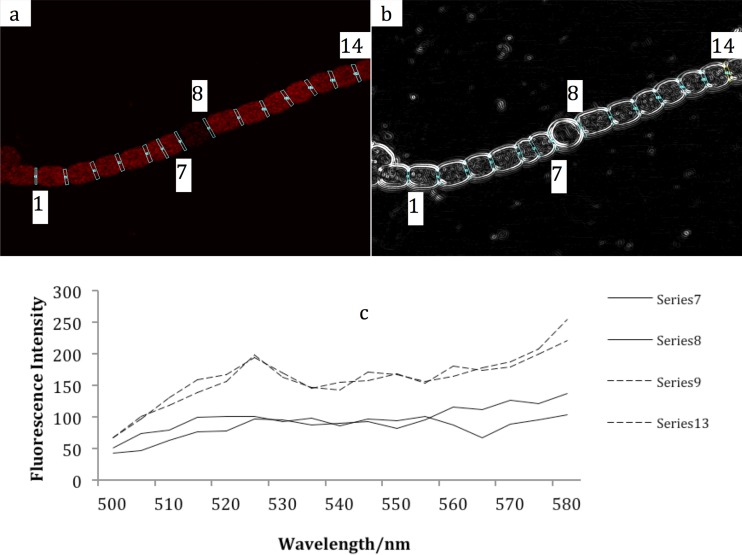
Fig 1.
Fluorescence of an Anabaena sp. strain PCC 7120 filament without Sakaguchi treatment. The sampling positions were chosen to show the intercellular connection of each pair of neighboring cells. (a) Fluorescence image; (b) DIC image. (c) The fluorescence spectra were obtained by excitation at 488 nm and scanning from 500 to 580 nm with 5 nm/step. Each series is the mean from 32 interfaces at the same position relative to a heterocyst.

