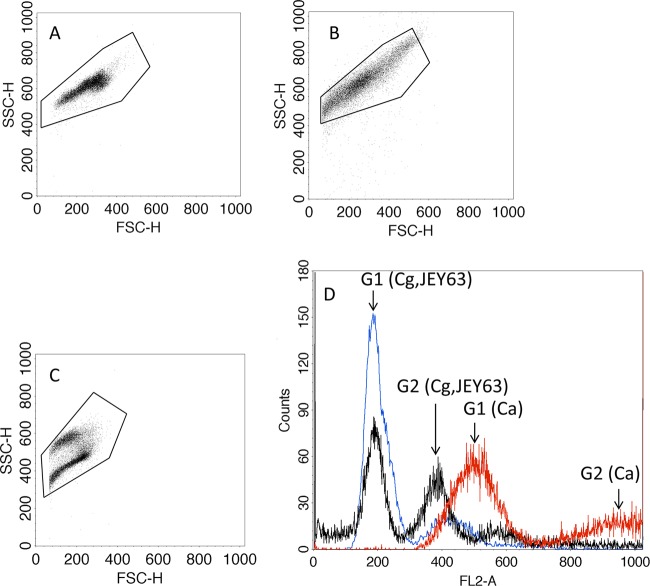
Fig 5.
Flow cytometry analysis of nucleic DNA from overnight culture and stained with propidium iodide. (A) C. albicans SC5314; (B) JEY63 (C. tunisiensis CBS 12513); (C) C. glabrata CBS 138; (D) overlay histograms. The G1 and G2 phases of each species are indicated by arrows (Ca, C. albicans, red color; Cg, C. glabrata, blue color; JEY63, black). C. albicans SC5314 and C. glabrata CBS 138 were included as standards to facilitate estimations of DNA content of JEY63. The SSC-H and FSC-H axes indicate side-scatter and forward-scatter channel intensities, respectively.

