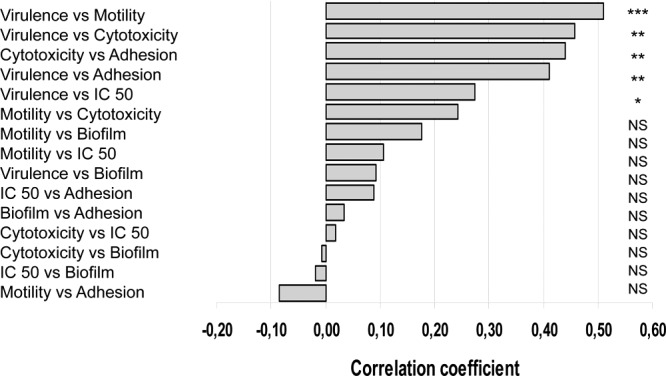
Fig 2.

Pairwise correlation between the virulence phenotypes and statistical significance of the correlation coefficients. Each phenotype was compared to each of the others in pairwise tests, and correlation coefficients were determined for each pair of phenotypes. *, P < 0.05; **, P < 0.005; ***, P < 0.0001; NS, not significant.
