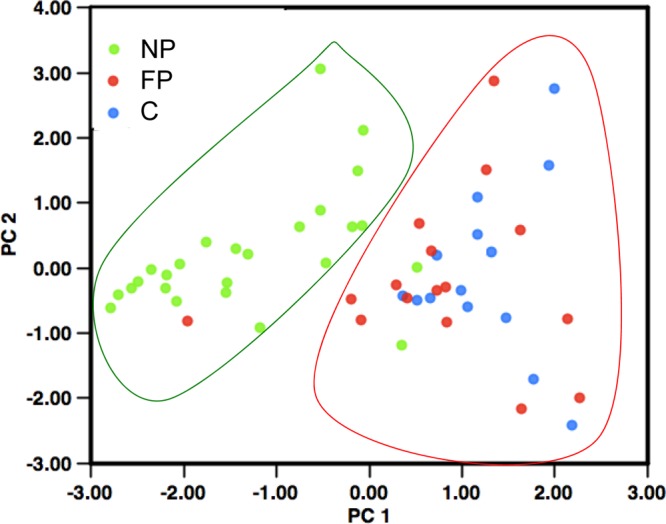
Fig 3.

Principal component analysis. PC1 corresponds to a combination of adhesion, motility, cytotoxicity, and virulence in insects. PC2 corresponds to biofilm formation and motility. Each B. cereus strain was plotted according to its values in PC analysis. Green, red, and blue spots correspond to NP, FP, and C strains, respectively.
