
Figure 4.
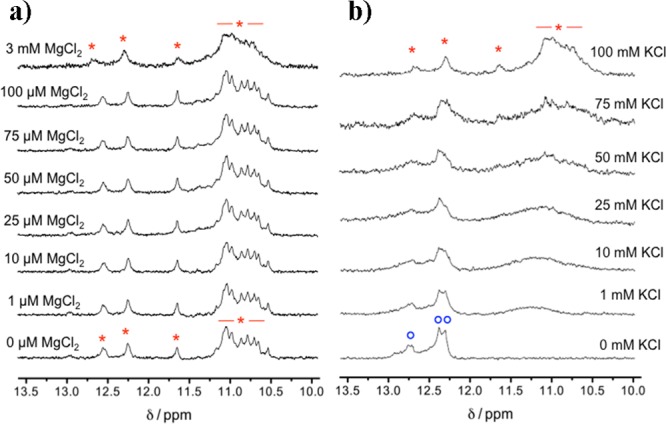
1H NMR titrations of the HpQd sequence with increasing amounts of (a) MgCl2 and (b) KCl. The initial spectra were acquired in 10 mM PBS (pH 7.0) in the presence of (a) 100 mM KCl and no MgCl2 and (b) 3 mM MgCl2 and no KCl. Signals labeled with red stars and blue circles correspond to the Qd and Hp structures, respectively.