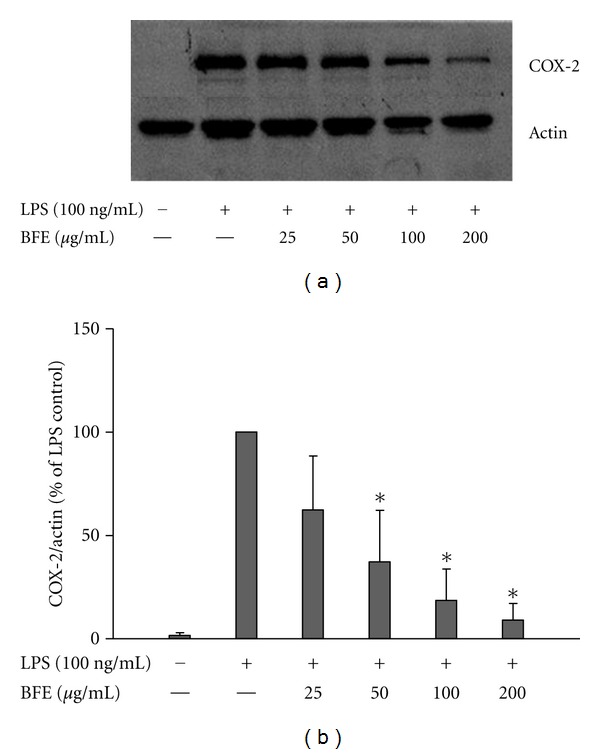
Figure 4.

(a) BFE inhibited COX-2 protein expression in LPS-stimulated primary microglia. Cells were stimulated with LPS (100 ng/mL) in the presence or absence of BFE (25–200 μg/mL) for 24 h. At the end of incubation period, COX-2 protein levels were measured using western blot using specific antibodies for each protein. (b) Quantitative densitometric analysis of COX-2 protein expression normalized to actin loading control. All values are expressed as mean ± SEM for 3 independent experiments. Data were analysed using one-way ANOVA for multiple comparison with post-hoc Student Newman-Keuls test. *P < 0.05 in comparison with LPS control.
