Fig 1.
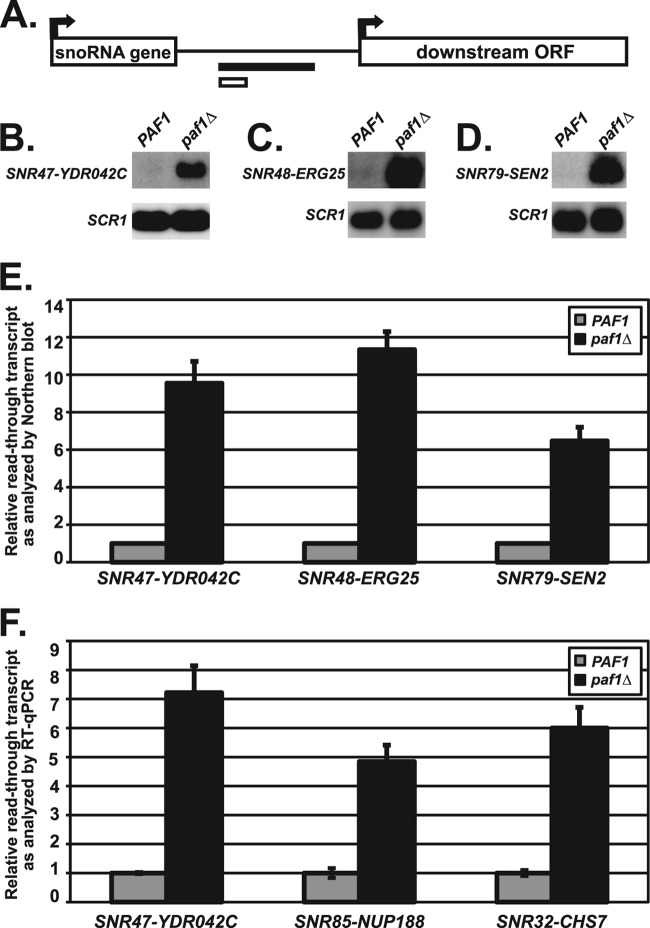
snoRNAs require Paf1 for proper 3′-end formation. (A) Depiction of regions downstream of the snoRNA genes that were used to design probes for Northern blot analysis (black bar) or amplification for RT-qPCR analysis (white bar). See Table 2 for details of all primers used. (B to D) Representative Northern blot analyses of extended snoRNA in wild-type cells (strains KY1699 [B], KY2278 [C], and KY2048[D]) and paf1Δ cells (strains KY1700 [B], KY2279 [C], and KY2279 [D]). Extended snoRNA transcripts were detected with probes to the intergenic region between the indicated snoRNA gene and the downstream ORF. SCR1 transcript levels serve as a loading control. (E) Quantification of extended SNR47, SNR48, and SNR79 transcript levels performed by Northern blot analysis with the relative signals of wild-type cells set at 1 as described in Materials and Methods. The SEMs of paf1Δ samples are indicated by the error bars. (F) Quantification of transcript levels in the regions between SNR47-YDR042C, SNR85-NUP188, and SNR32-CHS7 in wild-type (KY2278) and paf1Δ (KY2279) cells as measured by RT-qPCR, with the relative signal of wild-type cells set at 1 as described in Materials and Methods. The SEMs are indicated by the error bars.

