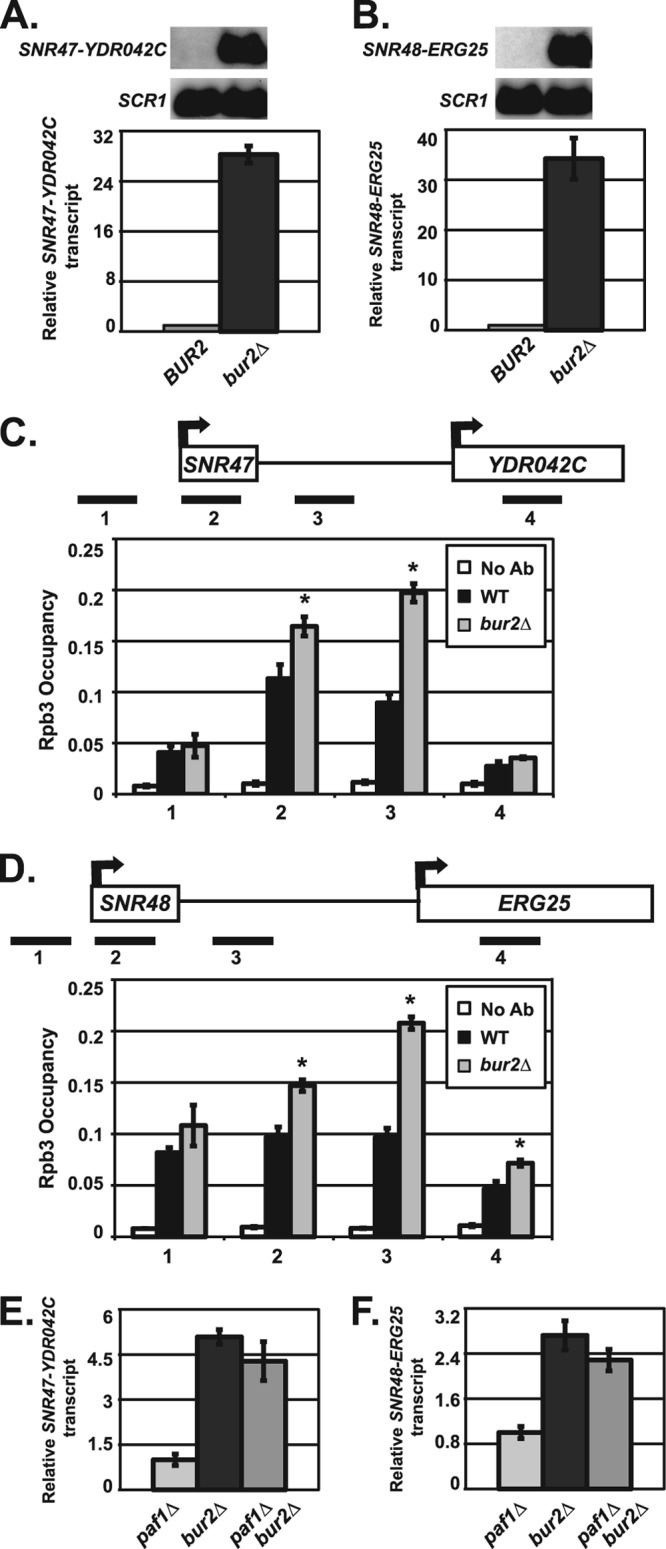
Fig 5.

Bur2 is required for proper snoRNA 3′-end formation. (A and B) Northern blot analyses were performed using RNA from wild-type (KY1699) and bur2Δ (KY1718) cells. SCR1 transcript levels serve as a loading control. For quantification, the relative signal of wild-type was set at 1. The SEMs of bur2Δ samples are indicated by the error bars. Representative Northern blot analysis and quantification of extended SNR47 (A) and SNR48 (B) transcripts are shown. (C and D) ChIP analysis of Rpb3 occupancy in wild-type (KY1699) and bur2Δ (KY1718) cells, which was examined near SNR47 (C) and SNR48 (D) at the indicated locations (see Table 2 for primers used). Quantification depicts average occupancy in three independent experiments. A no-antibody control (No Ab) was performed using wild-type (KY1699) cells. The SEMs are indicated by error bars, and asterisks indicate a P value of <0.05 relative to the value for the wild type. (E and F) Quantification of Northern blot analyses of extended SNR47 (E) and SNR48 (F) transcripts in paf1Δ (KY1700), bur2Δ (KY1718), and paf1Δ bur2Δ (KY1453) cells. The relative signal of paf1Δ was set at 1, and the SEMs are indicated.
