Figure 2.

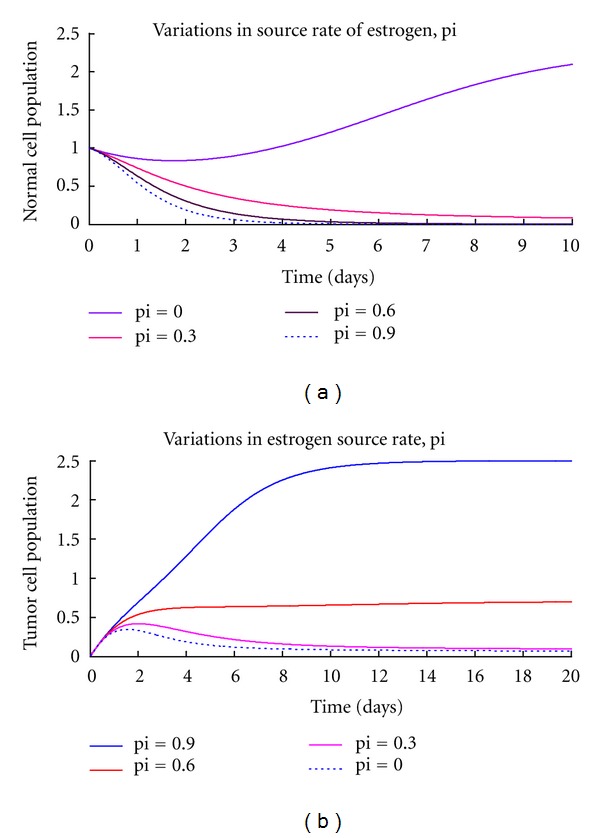
(a), (b) are graphs of numerical solutions showing the propagation of normal cells and tumor cells, respectively, with estrogen variations.

(a), (b) are graphs of numerical solutions showing the propagation of normal cells and tumor cells, respectively, with estrogen variations.