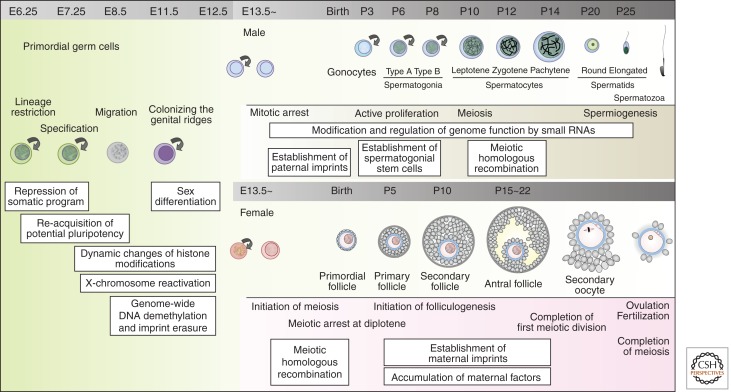
Figure 1.
A schematic representation of germ cell development in mice. A brief outline of germ cell development in mice is shown schematically. Key events associated with each stage of germ cell development are also shown. (Left) PGC development (from E6.25 to ∼E12.5); (upper right) male germ cell development (from ∼E13.5); (lower right) female germ cell development (from ∼E13.5).

