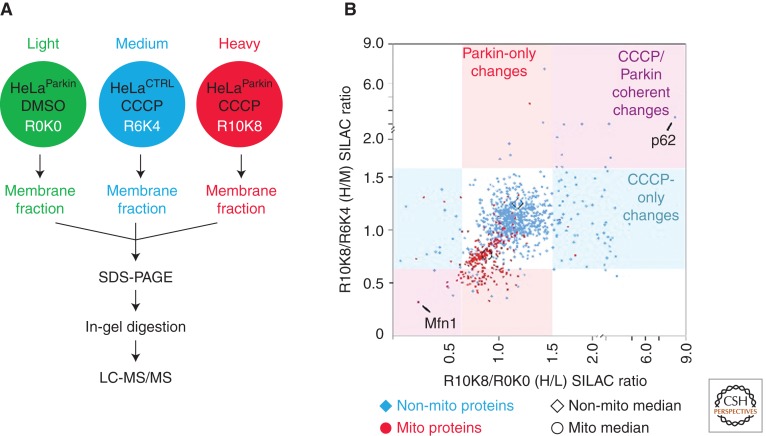
Figure 2.
Quantitative proteomics-based screen for the identification of Parkin substrates and adaptors in the PINK1/Parkin pathway. (A) Schematic depicting the experimental setup. Three cell lines were labeled with stable isotopes of arginine and lysine to give a light (L) labeled HeLa cell line stably expressing YFP-Parkin treated with vehicle (HeLaParkin); a medium (M) labeled HeLa cell line without Parkin expression treated with the mitochondrial uncoupler CCCP for 2 h (HeLaCTRL); and a heavy (H) labeled HeLaParkin cell line treated with CCCP. A crude membrane fraction was extracted from each cell line by permeabilizing the membranes with a low dose of digitonin, isolating the membranes by centrifugation, and then extracting proteins from the remaining membranes with DDM (n-dodecyl-β-maltoside). The protein extracts from each cell line were mixed in a 1:1:1 ratio, before separation on a SDS-PAGE gel, in-gel digestion, and LC-MS/MS on an Orbitrap instrument with a top 5 duty cycle. The data was analyzed in MaxQuant. (B) Scatter plot depicting H/L (x-axis) and H/M (y-axis) ratios for 992 proteins identified in the experiment. Proteins with “mitochondrial” in the protein name appear as red circles, whereas the others appear as blue diamonds. The median for proteins annotated as mitochondrial is shifted down and to the left relative to the median for other proteins consistent with the en masse degradation of mitochondrial proteins following treatment with CCCP in the presence of Parkin expression. Proteins in the upper right quadrant represent potential adaptors recruited to mitochondria. Proteins in the lower left quadrant represent potential substrates of Parkin. The protein with the largest increase along the x- and y-axes, p62, and the largest decrease, Mfn1, are labeled on the plot.

