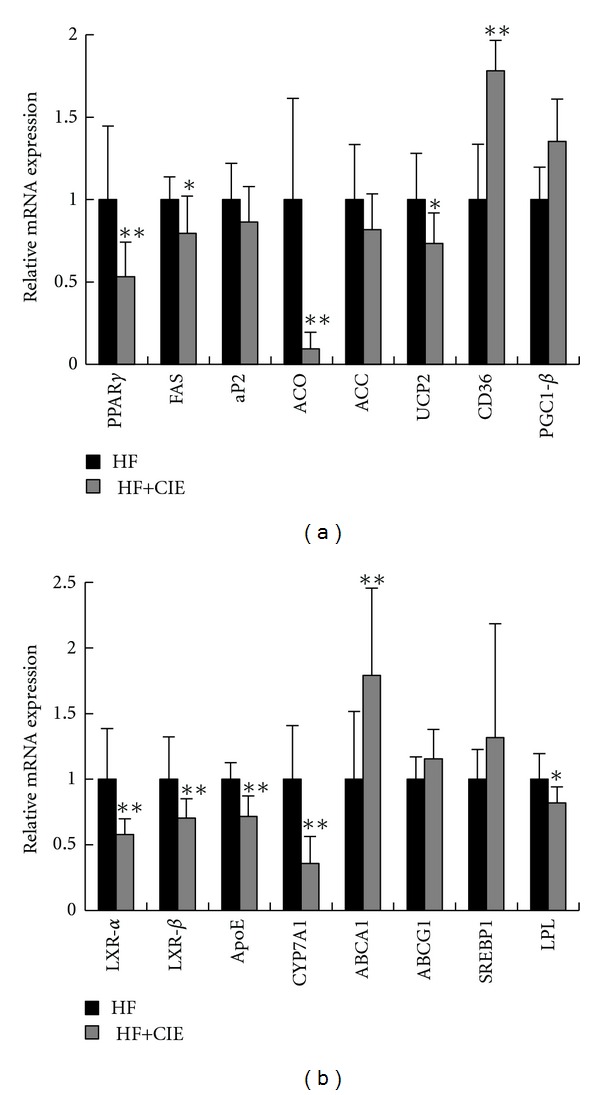
Figure 5.

Effects of CIE on the relative mRNA expression in liver tissue. (a) PPARγ and its target genes. (b) LXR and its target genes. Beta-actin was used as an internal control. Values are expressed as means ± S.E. (n = 7; *P < 0.05, **P < 0.01, versus the HF group).
