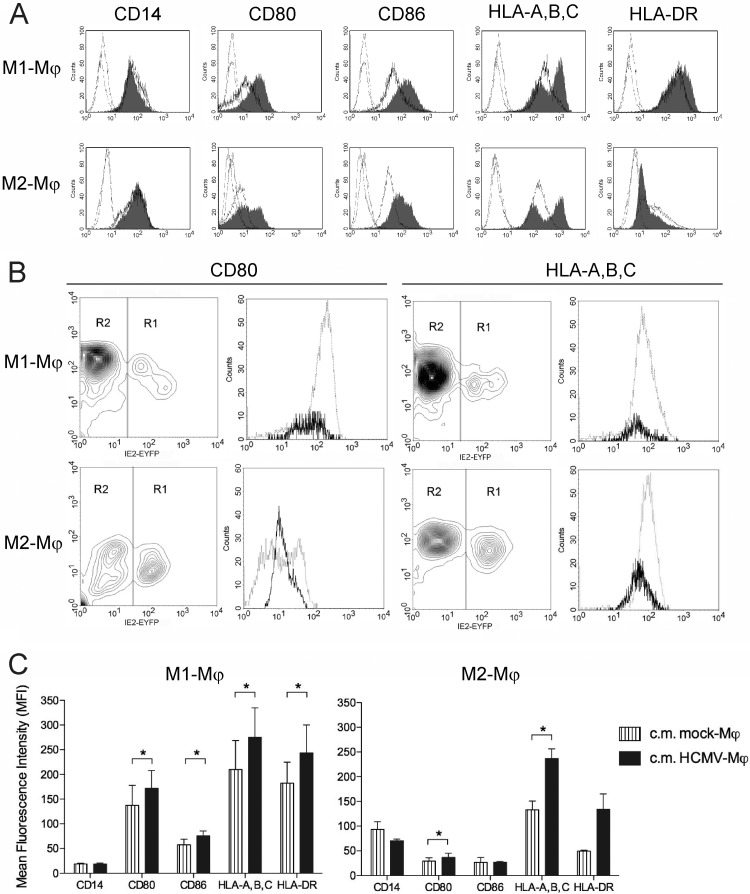
Fig 5.
Direct and bystander effects exerted by HCMV on M1 and M2 Mϕ. (A) At 1 day postinfection, mock- and HCMV-infected Mϕ (TB40E, MOI of 5) were harvested, stained for the indicated markers, and examined by flow cytometry. Cell surface expression of the indicated molecules was investigated in mock- and HCMV-infected Mϕ (thick-line histograms and gray-filled histograms, respectively). Staining with isotype-matched control antibodies (thin-line histograms) in mock- and HCMV-infected Mϕ is shown. Representative data from one of 10 blood donors are shown. (B) M1 and M2 Mϕ were infected with TB4-IE2-EYFP (MOI 5) for 24 h and then stained with PE-conjugated anti-CD80 and anti-HLA-A,B,C antibodies (the fluorescence intensity for these markers is shown on the y axes). On the basis of the IE2 green fluorescence (shown on the x axes), cells were gated into either region 1 (R1, IE2 antigen positive) or region 2 (R2, IE2 antigen negative). Thick-line histograms depict cells gated in R1, while thin-line histograms depict cells gated in R2. Representative data from one of five experiments (five blood donors) are shown. (C) M1 and M2 Mϕ (obtained from four different donors) were seeded in fresh medium (1 × 10⁶ cells/ml) and either left untreated (mock-Mϕ) or infected with TB40E at an MOI of 5 (HCMV-Mϕ,); 24 h later, the conditioned media (c.m.) were collected, centrifuged, filtered in order to remove cell debris and viral particles, and pooled together. Freshly prepared M1 and M2 Mϕ were incubated in the conditioned media for 24 h before the expression of the indicated molecules was measured as mean fluorescence intensity. Results are means ± standard errors of the means (SEM) from three experiments (three blood donors). *, P < 0.05.

