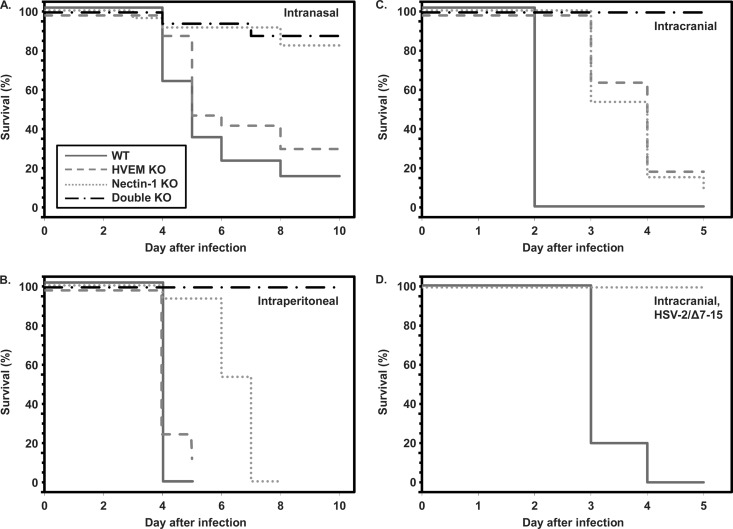
Fig 1.
Survival of neonatal mice of different genotypes infected with HSV-2 by the intranasal (A), intraperitoneal (B), and intracranial (C and D) routes. Panel A shows the symbol key for all plots. More than 15 mice per genotype were studied to generate the mortality data after i.n. inoculation, while other data are from 7 to 15 mice per genotype. (A) Kaplan-Meier analysis of mortality after i.n. inoculation demonstrates statistically significant differences in time to death for nectin-1 KO compared with WT (P = 0.0006) or HVEM KO (P = 0.007) mice and for double-KO versus WT (P = 0.0002) or HVEM KO (P = 0.002) mice. The difference in survival between WT and HVEM KO mice did not reach statistical significance (P = 0.08), and there was no difference between nectin-1 KO and double-KO mice (P = 0.78). (B) Kaplan-Meier analysis of mortality after i.p. inoculation identifies statistically significant differences in time to death for nectin-1 KO compared with WT (P < 0.0001) or HVEM KO (P = 0.0002) mice and for double-KO versus WT (P = 0.0002), HVEM KO (P = 0.0012), and nectin-1 KO mice (P = 0.015). The difference in survival between WT and HVEM KO mice did not reach statistical significance (P = 0.14). (C) Kaplan-Meier analysis of mortality after i.c. inoculation with HSV-2 (333) demonstrates statistically significant differences in time to death for HVEM KO, nectin-1 KO, and double-KO mice compared with WT mice (P < 0.0001). There was no difference between HVEM KO and nectin-1 KO mice (P = 0.66), while both groups were statistically different from double-KO mice (P < 0.0008). (D) Inoculation of WT or nectin-1 KO mice with HSV-2/Δ7–15, which is unable to engage HVEM, shows statistically significant difference in time to death for WT mice versus nectin-1 KO mice (P < 0.0001).

