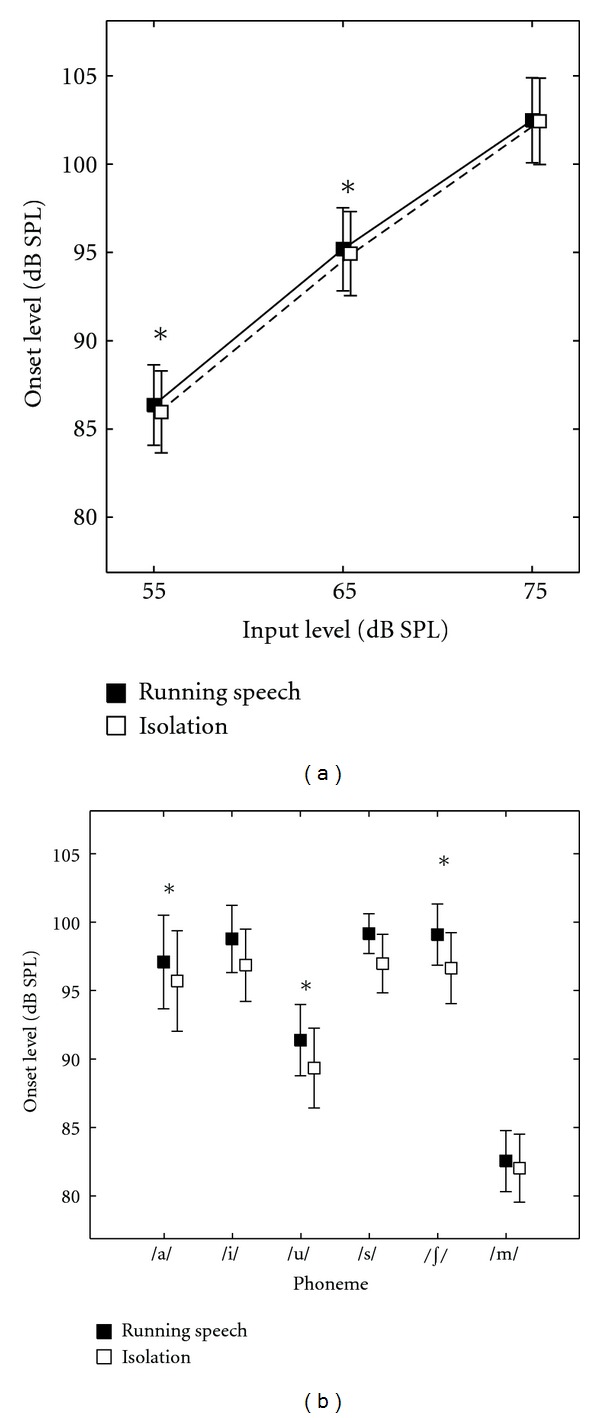
Figure 3.

(a) presents variation of phoneme onset level in running speech and isolation context across input levels. (b) presents the same across phonemes. Error bars represent SE. ∗ indicates a statistically significant difference in paired contrasts. The symbols have been offset slightly to improve clarity.
