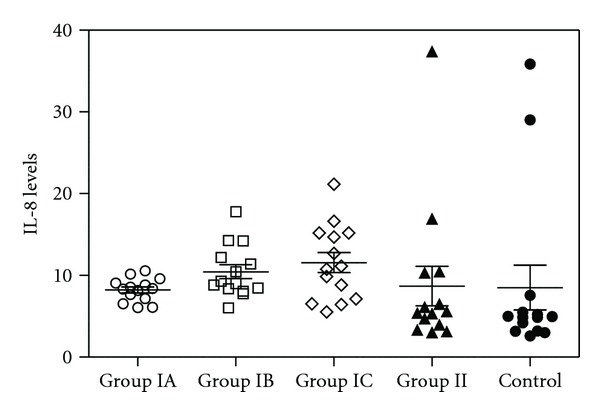
Figure 1.

Plot graphic of serum IL-8 concentrations in all groups. The numbers of samples of the all groups are 14 for each. Group IA: severe persistent asthma patients before the treatment. Group IB: 4 months after the anti-IgE therapy, severe persistent asthma patients. Group IC: 18 months after the anti-IgE therapy, severe persistent asthma patients. Group II: newly diagnosed controlled allergic asthma patients. Group III: healthy individuals as control. P values were as below: Group IA versus IB: P = 0.02, Group IA versus IC: P = 0.019, Group IA versus II: P = 0.42, Group IA versus Control: P = 0.46, Group IB versus IC: P = 0.27, Group IB versus Control: P = 0.25, Group IC versus Control: P = 0.16, and Group II versus Control: P = 0.48.
