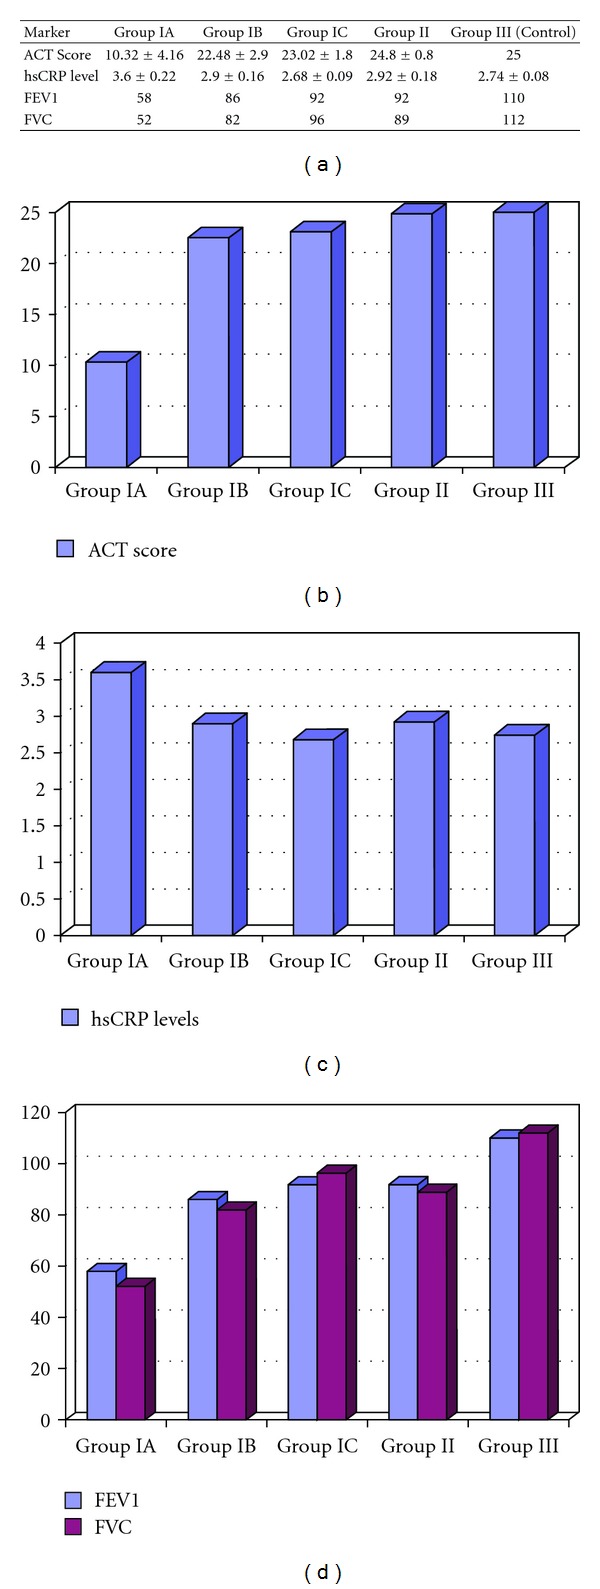
Figure 6.

Clinical follow-up markers; FEV1/FVC rate, serum hsCRP levels, and ACT score of groups. ACT score was significantly increased similar to the controls after anti-IgE therapy (Group IA versus IB: P = 0.005). HsCRP levels were significantly decreased to the levels of controls after the treatment (Group IA versus IB: P = 0.04 and Group IA versus IC: P = 0.02). FEV1 and FVC values also significantly increased by the anti-IgE treatment depending on the time of therapy (FEV1: Group IA versus IB: P = 0.02 and Group IA versus IC: P = 0.01 and FVC: Group IA versus IB: P = 0.01 and Group IA versus IC: P = 0.008). Values are presented as mean ± standard deviation (SD). Additional bar graphs used to compare data are given.
