
Figure 2.
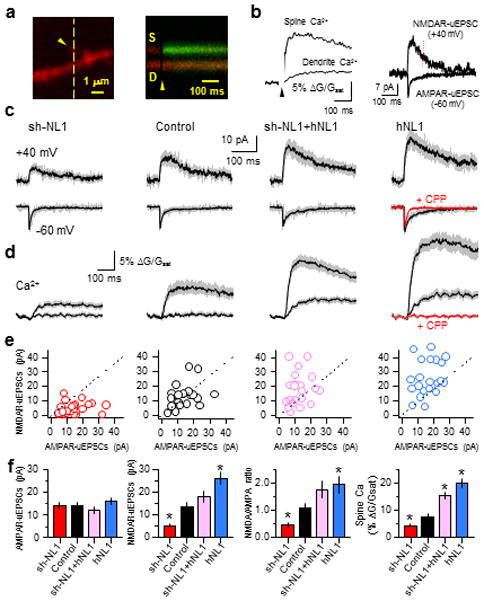
Neuroligin-1 modulates NMDAR-mediated currents and Ca2+ signaling at individual postsynaptic terminals
(a) left, Image of a spine and dendrite filled with 20 μM Alexa-594 and 300 μM Fluo-5F showing the location of the glutamate uncaging spot (arrow head) and the orientation of the line scan (dashed line). right, Time course of fluorescent transients measured in the line scan following glutamate uncaging at the time indicated by the arrow head. Increased green fluorescence indicates Ca2+ entry.
(b) left, Quantification of the green fluorescence transient in the spine and neighboring dendrite at −60 mV. right, AMPAR- and NMDAR-mediated uEPSCs at −60 and +40 mV, respectively. The red dashed line (70 ms after uncaging pulse) indicates the time at which the amplitude of NMDAR-uEPSCs was measured.
(c) Average uEPSCs at −60 mV and +40 mV for neurons of the indicated genotypes and from hNL1 transfected neurons in the presence of CPP (red trace).
(d) Average Ca2+ transients in spines (larger traces) and dendrites (smaller traces) for neurons of the indicated genotypes −60 mV.
(e) Distributions of AMPAR- and NMDAR-uEPSCs amplitudes for each spinein each genotype.
(f) Summary of (left to right) AMPAR-uEPSC amplitude, NMDAR-uEPSC amplitude, NMDAR- to AMPAR-uEPSC amplitude ratio, and spine Ca2+ are shown. Error bars represent s.e.m.