
Figure 6.
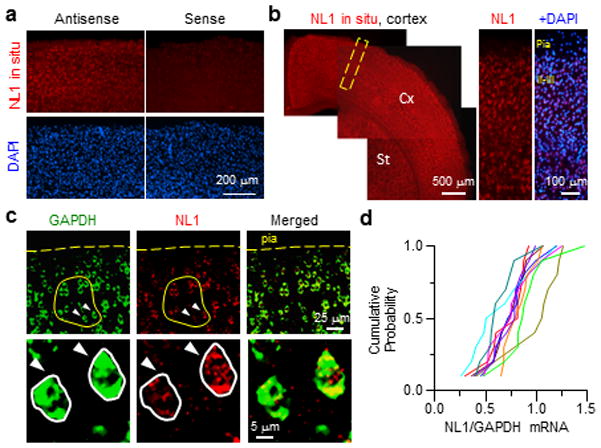
Variable NL1 mRNA in across cortical neurons
(a) Fluorescence ISH using an antisense Neuroligin-1 riboprobe (left) shows NL1 mRNA detection in the cortex compared to control ISH with a sense riboprobe (right).
(b) NL1 mRNA is expressed broadly (left, Cx: cortex, St: striatum). A high magnification image (right) of the cortex (dotted box) shows NL1 mRNA in all cortical layers.
(c) Double ISH shows GAPDH (left) and NL1 (middle) in individual layer 2/3 neurons (top). Representative images of neighboring neurons (arrowheads) showing differential NL1 mRNA expression in spite of relatively consistent GAPDH mRNA levels (bottom).
(d) Cumulative probability distribution of NL1/GAPDH ISH fluorescence ratios from 10 sets (1 per/section, 3 mice) of 10 randomly picked neighboring neurons (yellow circle in (c)).