
Figure 7.
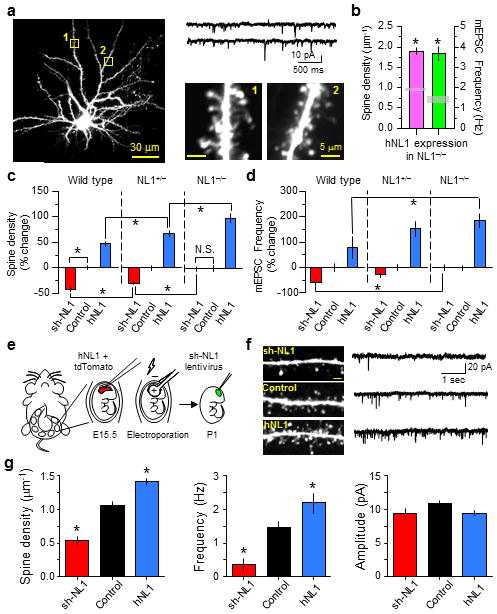
Relative levels of NL1 determine spine number in vivo via intercellular interactions
(a) Representative hNL1-transfected neuron in an NL1−/− mouse showing spines and mEPSCs.
(b) Average spine density and mEPSC frequency from hNL1-expressing neurons in NL1−/− mice. The gray boxes indicate the values in control neurons.
(c–d) Spine density and mEPSC frequency are differently affected by manipulating NL1 levels up (hNL1) or down (shNL1) depending the levels of NL1 in the surrounding neurons.
(e) Schematic of the experimental design. Mice were in utero electroporated with hNL1 + tdTomato, followed by injection of sh-NL1 encoding lentivirus into cortex at P1.
(f) Left, representative images of spines from layer 2/3 pyramidal neurons infected with sh-NL1 lentivirus (top), neighboring controls (middle), or electroporated with hNL1 + tdTomato (bottom). Right, representative mEPSCs for the same 3 neuronal classes. Scale bars, 2 μm, 2 pA and 1s.
(g) Average spine density, mEPSC frequency and amplitude in sh-NL1, control and hNL1 neurons analyzed in the same slices. Error bars: s.e.m. *: p<0.05 on post hoc multiple comparison tests relative to control.